Followup on Antarctic Melt Rates

I got an email today in response to this post that allows me to cover some ground I wanted to cover.  A number of commenters are citing this paragraph from Tedesco and Monaghan as evidence that I and others are somehow mischaracterizing the results of the study:

“Negative melting anomalies observed in recent years do not contradict recently published results on surface temperature trends over Antarctica [e.g., Steig et al., 2009]. The time period used for those studies extends back to the 1950’s, well beyond 1980, and the largest temperature increases are found during winter and spring rather than summer, and are generally limited to West Antarctica and the Antarctic Peninsula. Summer SAM trends have increased since the 1970s [Marshall, 2003], suppressing warming over much of Antarctica during the satellite melt record [Turner et al., 2005]. Moreover, melting and surface temperature are not necessarily linearly related because the entire surface energy balance must be considered [Liston and Winther, 2005; Torinesi et al., 2003].”

First, the point of the original post was not about somehow falsifying global warming, but about the asymmetry in press coverage to emerging data.  It is in fact staggeringly unlikely that I would use claims of increasing ice buildup in Antarctica as “proof” that anthropogenic global warming theory as outlined, say, by the fourth IPCC report, is falsified.  This is because the models in the fourth IPCC report actually predict increasing snowmass in Antarctica under global warming.

Of course, the study was not exactly increasing ice mass, but decreasing ice melting rates, which should be more correlated with temperatures.  Which brings us to the quote above.
I see a lot of studies in climate that seem to have results that falsify some portion of AGW theory but which throw in acknowledgments of the truth and beauty of catastrophic anthropogenic global warming theory in the final paragraphs that almost contradict their study results, much like natural philosophers in past centuries would put in boiler plate in their writing to protect them from the ire of the Catholic Church.   One way to interpret this statement is “I know you are not going to like these findings but I am still loyal to the Cause so please don’t revoke by AGW decoder ring.”

This particular statement by the authors is hilarious in one way.  Their stated defense is that Steig’s period was longer and thus not comparable.  The don’t outright say it, but they kind of beat around the bush at it, that the real issue is not the study length, but that most of the warming in Steig’s 50-year period was actually in the first 20 yearsThis is in fact something we skeptics have been saying since Steig was released, but was not forthrightly acknowledged in Steig.   Here is some work that has been done to deconstruct the numbers in Steig.  Don’t worry about the cases with different numbers of “PCs”, these are just sensitivities with different geographic regionalizations.  Basically, under any set of replication approaches to Steig, all the warming is in the first 2 decades.

Reconstruction

1957 to 2006 trend

1957 to 1979 trend (pre-AWS)

1980 to 2006 trend (AWS era)

Steig 3 PC

+0.14 deg C./decade

+0.17 deg C./decade

-0.06 deg C./decade

New 7 PC

+0.11 deg C./decade

+0.25 deg C./decade

-0.20 deg C./decade

New 7 PC weighted

+0.09 deg C./decade

+0.22 deg C./decade

-0.20 deg C./decade

New 7 PC wgtd imputed cells

+0.08 deg C./decade

+0.22 deg C./decade

-0.21 deg C./decade

Now, knowing this, here is Steig’s synopsis:

Assessments of Antarctic temperature change have emphasized the contrast between strong warming of the Antarctic Peninsula and slight cooling of the Antarctic continental interior in recent decades1. This pattern of temperature change has been attributed to the increased strength of the circumpolar westerlies, largely in response to changes in stratospheric ozone2. This picture, however, is substantially incomplete owing to the sparseness and short duration of the observations. Here we show that significant warming extends well beyond the Antarctic Peninsula to cover most of West Antarctica, an area of warming much larger than previously reported. West Antarctic warming exceeds 0.1 °C per decade over the past 50 years, and is strongest in winter and spring. Although this is partly offset by autumn cooling in East Antarctica, the continent-wide average near-surface temperature trend is positive. Simulations using a general circulation model reproduce the essential features of the spatial pattern and the long-term trend, and we suggest that neither can be attributed directly to increases in the strength of the westerlies. Instead, regional changes in atmospheric circulation and associated changes in sea surface temperature and sea ice are required to explain the enhanced warming in West Antarctica.

Wow – don’t see much acknowledgment that all the warming trend was before 1980.   They find the space to recognize seasonal differences but not the fact that all the warming they found was in the first 40% of their study period?   (And all of the above is not even to get into the huge flaws in the Steig methodology, which purports to deemphasize the Antarctic Peninsula but still does not)

This is where the semantic games of trying to keep the science consistent with a political position get to be a problem.  If Steig et al had just said “Antarctica warmed from 1957 to 1979 and then has cooled since,” which is what their data showed, then the authors of this new study would not have been in a quandary.  In that alternate universe, of course decreased ice melt since 1980 makes sense, because Steig said it was cooler.  But because the illusion must be maintained that Steig showed a warming trend that continues to this date, these guys must deal with the fact that their study agrees with the data in Steig, but not the public conclusions drawn from Steig.  And thus they have to jump through some semantic hoops.

Telling Half the Story 100% of the Time

By now, I think most readers of this site have seen the asymmetry in reporting of changes in sea ice extent between the Arctic and the Antarctic.  On the exact same day in 2007 that seemingly every paper on the planet was reporting that Arctic sea ice extent was at an “all-time” low, it turns out that Antarctic sea ice extent was at an “all-time” high.  I put “all-time” in quotes because both were based on satellite measurements that began in 1979, so buy “all-time” newspapers meant not the 5 billion year history of earth or the 250,000 year history of man or the 5000 year history of civilization but instead the 28 year history of space measurement.  Oh, that “all time”.

It turns out there is a parallel story with land-based ice and snow.  First some background

As most folks know, melting sea ice has no effect on world ocean heights — only melting of ice on land affects sea levels.   This land-based ice is distributed approximately as follows:

Antarctica:  89%

Greenland: 10%

Glaciers around the world: 1%

I won’t go into glaciers, in part because their effect is small, but suffice it to say they are melting, but they have been observed melting and retreating for 200 years, which makes this phenomenon hard to square with Co2 buildups over the last 50 years.

I am also not going to talk much about Greenland.  The implication of late has been that Greenland ice is melting fast and such melting is somehow unprecedented, so that it must be due to modern man.  This is of course slightly hard to square with the historical fact of how Greenland got its name, and the fact that it was warmer a thousand years ago than it is today.

But I am sure you have heard panic and doom in innumerable articles about 11% of the world’s land ice.   But what about the other 89%.  Crickets?

This may be why you never hear anything:

From World Climate Report: Antarctic Ice Melt at Lowest Levels in Satellite Era

Where are the headlines? Where are the press releases? Where is all the attention?

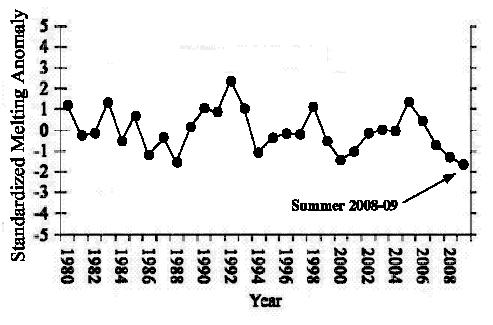
The ice melt across during the Antarctic summer (October-January) of 2008-2009 was the lowest ever recorded in the satellite history.

Such was the finding reported last week by Marco Tedesco and Andrew Monaghan in the journal Geophysical Research Letters:

A 30-year minimum Antarctic snowmelt record occurred during austral summer 2008–2009 according to spaceborne microwave observations for 1980–2009. Strong positive phases of both the El-Niño Southern Oscillation (ENSO) and the Southern Hemisphere Annular Mode (SAM) were recorded during the months leading up to and including the 2008–2009 melt season.

antarctica_icemelt

Figure 1. Standardized values of the Antarctic snow melt index (October-January) from 1980-2009 (adapted from Tedesco and Monaghan, 2009).

The silence surrounding this publication was deafening.

By the way, in case you think there may be some dueling methodologies here – ie that the scientists measuring melting in Greenland are professional real scientists while the guys doing the Antarctic work are somehow skeptic quacks, the lead author of this Antarctic study is the same guy who authored many of the Greenland melting studies that have made the press.  Same author.  Same methodology.  Same focus (on ice melting rates).  Same treatment in the press?   No way.  Publish the results only if they support the catastrophic view of global warming.

So — 11% of world’s land ice shrinking – Front page headlines.  89% of world’s land ice growing.  Silence.

UPDATE: Followup  here

Phoenix Climate Presentation, November 10 at 7PM

I have given a number of presentations on climate change around the country and have taken the skeptic side in a number of debates, but I have never done anything in my home city of Phoenix.

Therefore, I will be making a presentation in Phoenix on November 10 at 7PM in the auditorium of the Phoenix Country Day School, on 40th Street just north of Camelback. Admission is free. My presentation is about an hour and I will have an additional hour for questions, criticism, and rebuttals from the audience.

I will be posting more detail later, but the presentation will include background on global warming theory, a discussion of why climate models are likely exaggerating future warming, and an evaluation of various policy alternatives. The presentation will be heavy on science and data, but is meant to be accessible without a science background. I will post more details of the agenda as we get closer to the event.

I am taking something of a risk with this presentation. I am paying for the auditorium and promotion myself — I am not doing this under the auspices of any group. However, I would like to get good attendance, in part because I would like the media representatives attending to see the local community demonstrating interest in at least giving the skeptic side of the debate a hearing. If you are a member of a group that might like to attend, please email me directly at the email link at the top of this page and I can help get more information and updates to your group.

Finally, I have created a mailing list for folks who would like more information about this presentation – just click on the link below. All I need is your name and email address.

Some Common Sense on Treemometers

I have written a lot about historic temperature proxies based on tree rings, but it all boils down to “trees make poor thermometers.”  There are just too many things, other than temperature, that can affect annual tree growth.  Anthony Watts has a brief article from one of his commenter that discusses some of these issues in a real-life way.  This in particular struck me as a strong dose of common sense:

The bristlecone records seemed a lousy proxy, because at the altitude where they grow it is below freezing nearly every night, and daytime temperatures are only above freezing for something like 10% of the year. They live on the borderline of existence, for trees, because trees go dormant when water freezes. (As soon as it drops below freezing the sap stops dripping into the sugar maple buckets.) Therefore the bristlecone pines were dormant 90% of all days and 99% of all nights, in a sense failing to collect temperature data all that time, yet they were supposedly a very important proxy for the entire planet. To that I just muttered “bunkum.”

He has more on Briffa’s increasingly famous single hockey stick tree.

More Hockey Stick Hyjinx

Update: Keith Briffa responds to the issues discussed below here.

Sorry I am a bit late with the latest hockey stick controversy, but I actually had some work at my real job.

At this point, spending much time on the effort to discredit variations of the hockey stick analysis is a bit like spending time debunking phlogiston as the key element of combustion.  But the media still seems to treat these analyses with respect, so I guess the effort is necessary.

Quick background:  For decades the consensus view was that earth was very warm during the middle ages, got cold around the 17th century, and has been steadily warming since, to a level today probably a bit short of where we were in the Middle Ages.  This was all flipped on its head by Michael Mann, who used tree ring studies to “prove” that the Medieval warm period, despite anecdotal evidence in the historic record (e.g. the name of Greenland) never existed, and that temperatures over the last 1000 years have been remarkably stable, shooting up only in the last 50 years to 1998 which he said was likely the hottest year of the last 1000 years.  This is called the hockey stick analysis, for the shape of the curve.

Since he published the study, a number of folks, most prominently Steve McIntyre, have found flaws in the analysis.  He claimed Mann used statistical techniques that would create a hockey stick from even white noise.  Further, Mann’s methodology took numerous individual “proxies” for temperatures, only a few of which had a hockey stick shape, and averaged them in a way to emphasize the data with the hockey stick.  Further, Mann has been accused of cherry-picking — leaving out proxy studies that don’t support his conclusion.  Another problem emerged as it became clear that recent updates to his proxies were showing declining temperatures, what is called “divergence.”  This did not mean that the world was not warming, but did mean that trees may not be very good thermometers.  Climate scientists like Mann and Keith Briffa scrambled for ways to hide the divergence problem, and even truncated data when necessary.  More hereMann has even flipped the physical relationship between a proxy and temperature upside down to get the result he wanted.

Since then, the climate community has tried to make itself feel better about this analysis by doing it multiple times, including some new proxies and new types of proxies (e.g. sediments vs. tree rings).  But if one looks at the studies, one is struck by the fact that its the same 10 guys over and over, either doing new versions of these studies or reviewing their buddies studies.  Scrutiny from outside of this tiny hockey stick society is not welcome.  Any posts critical of their work are scrubbed from the comment sections of RealClimate.com (in contrast to the rich discussions that occur at McIntyre’s site or even this one) — a site has even been set up independently to archive comments deleted from Real Climate.  This is a constant theme in climate.  Check this policy out — when one side of the scientific debate allows open discussion by all comers, and the other side censors all dissent, which do you trust?

Anyway, all these studies have shared a couple of traits in common:

  • They have statistical methodologies to emphasize the hockey stick
  • They cherry pick data that will support their hypothesis
  • They refuse to archive data or make it available for replication

The some extent, the recent to-do about Briffa and the Yamal data set have all the same elements.  But this one appears to have a new one — not only are the data sets cherry-picked, but there is growing evidence that the data within a data set has been cherry picked.

Yamal is important for the following reason – remember what I said above about just a few data sets driving the whole hockey stick.  These couple of data sets are the crack cocaine to which all these scientists are addicted.  They are the active ingredient.  The various hockey stick studies may vary in their choice of proxy sets, but they all include a core of the same two or three that they know with confidence will drive the result they want, as long as they are careful not to water them down with too many other proxies.

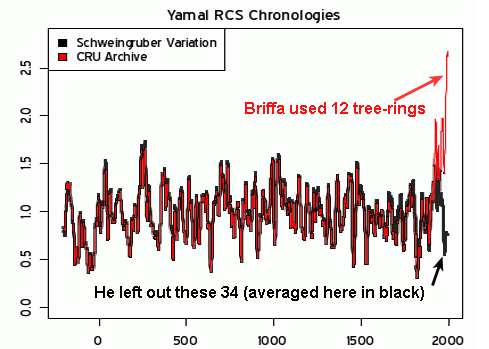
Here is McIntyre’s original post.   For some reason, the data set Briffa uses falls off to ridiculously few samples in recent years (exactly when you would expect more).  Not coincidentally, the hockey stick appears exactly as the number of data points falls towards 10 and then 5 (from 30-40).  If you want a longer, but more layman’s view, Bishop Hill blog has summarized the whole storyUpdateMore here, with lots of the links I didn’t have time this morning to find.

Postscript: When backed against the wall with no response, the Real Climate community’s ultimate response to issues like this is “Well, it doesn’t matter.”  Expect this soon.

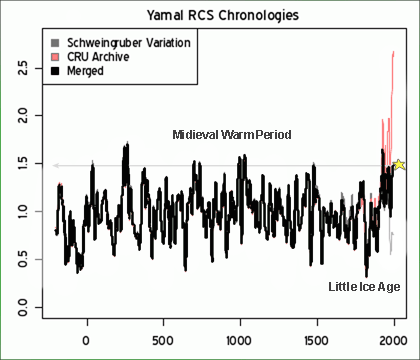
Update: Here are the two key charts, as annotated by JoNova:

rcs_chronologies1v2

And it “matters”

yamal-mcintyre-fig2

What A Daring Guy

Joe Romm has gone on the record at Climate Progress on April 13, 2009 that the “median” forecast was for warming in the US by 2100 of 10-15F, or 5.5-8.3C, and he made it very clear that if he had to pick a single number, it would be the high end of that range.

On average, the 8.3C implies about 0.9C per decade of warming.  This might vary slightly by what starting point he intended (he is not very clear in the post) and I understand there is a curve so it will be below average in the early years and above in the later.

Anyway, Joe Romm is ready to put his money where his mouth is, and wants to make a 50/50 bet with any comers that warming in the next decade will be… 0.15C.  Boy, it sure is daring for a guy who is constantly in the press at a number around 0.9C per decade to commit to a number 6 times lower when he puts his money where his mouth is.   Especially when Romm has argued that warming in the last decade has been suppressed (somehow) and will pop back up soon.  Lucia has more reasons why this is a chickensh*t bet.

I deconstructed a previous gutless bet by Nate Silver here.

Have You Checked the Couch Cushions?

Patrick Michaels describes some of the long history of the Hadley Center and specifically Phil Jones’ resistance to third party verification of their global temperature data.  First he simply refused to share the data

We have 25 years or so invested in the work. Why should I make the data available to you, when your aim is to try and find something wrong with it?

(that’s some scientist, huh) and then he said he couldn’t share the data and now he says he’s lost the data.

Michaels gives pretty good context to the issues of station siting, but there are many other issues that are perfectly valid reasons for third parties to review the Hadley Center’s methodology.  A lot of choices have to be made in patching data holes and in giving weights to different stations and attempting to correct for station biases.  Transparency is needed for all of these methodologies and decisions.  What Jones is worried about is whenever the broader community (and particularly McIntyre and his community on his web site) have a go at such methodologies, they have always found gaping holes and biases.  Since the Hadley data is the bedrock on which rests almost everything done by the IPCC, the costs of it being found wrong are very high.

Here is an example post from the past on station siting and measurement quality.  Here is a post for this same station on correction and aggregation of station data, and problems therein.

Great Moments in Skepticism and “Settled Science”

Via Radley Balko:

The phrase shaken baby syndrome entered the pop culture lexicon in 1997, when British au pair Louise Woodward was convicted of involuntary manslaughter in the death of Massachusetts infant Matthew Eappen. At the time, the medical community almost universally agreed on the symptoms of SBS. But starting around 1999, a fringe group of SBS skeptics began growing into a powerful reform movement. The Woodward case brought additional attention to the issue, inviting new research into the legitimacy of SBS. Today, as reflected in the Edmunds case, there are significant doubts about both the diagnosis of SBS and how it’s being used in court.

In a compelling article published this month in the Washington University Law Review, DePaul University law professor Deborah Teurkheimer argues that the medical research has now shifted to the point where U.S. courts must conduct a major review of most SBS cases from the last 20 years. The problem, Teurkheimer explains, is that the presence of three symptoms in an infant victim—bleeding at the back of the eye, bleeding in the protective area of the brain, and brain swelling—have led doctors and child protective workers to immediately reach a conclusion of SBS. These symptoms have long been considered pathognomic, or exclusive, to SBS. As this line of thinking goes, if those three symptoms are present in the autopsy, then the child could only have been shaken to death.

Moreover, an SBS medical diagnosis has typically served as a legal diagnosis as well. Medical consensus previously held that these symptoms present immediately in the victim. Therefore, a diagnosis of SBS established cause of death (shaking), the identity of the killer (the person who was with the child when it died), and even the intent of the accused (the vigorous nature of the shaking established mens rea). Medical opinion was so uniform that the accused, like Edmunds, often didn’t bother questioning the science. Instead, they’d often try to establish the possibility that someone else shook the child.

But now the consensus has shifted. Where the near-unanimous opinion once held that the SBS triad of symptoms could only result from a shaking with the force equivalent of a fall from a three-story to four-story window, or a car moving at 25 mph to 40 mph (depending on the source), research completed in 2003 using lifelike infant dolls suggested that vigorous human shaking produces bleeding similar to that of only a 2-foot to 3-foot fall. Furthermore, the shaking experiments failed to produce symptoms with the severity of those typically seen in SBS deaths….
When I put all of this together, I said, my God, this is a sham,” Uscinski told Discover. “Somebody made a mistake right at the very beginning, and look at what’s come out of it.”

Before I am purposefully misunderstood, I am not committing the logical fallacy that an incorrect consensus in issue A means the consensus on issue B is incorrect.  The message instead is simple:  beware scientific “consensus,” particularly when that consensus is only a decade or two old.

Good News / Bad News for Media Science

The good news:  The AZ Republic actually published a front page story (link now fixed) on the urban heat island effect in Phoenix, and has a discussion of how changes in ground cover, vegetation, and landscaping can have substantial effects on temperatures, even over short distances.  Roger Pielke would be thrilled, as he has trouble getting even the UN IPCC to acknowledge this fact.

The bad news:  The bad news comes in three parts

  1. The whole focus of the story is staged in the context of rich-poor class warfare, as if the urban heat island effect is something the rich impose on the poor.  It is clear that without this class warfare angle, it probably would never have made the editorial cut for the paper.
  2. In putting all the blame on “the rich,” they miss the true culprit, which are leftish urban planners whose entire life goal is to increase urban densities and eliminate suburban “sprawl” and 2-acre lots.  But it is the very densities that cause the poor to live in the hottest temperatures, and it is the 2-acre lots that shelter “the rich” from the heat island effects.
  3. Not once do the authors take the opportunity to point out that such urban heat island effects are likely exaggerating our perceptions of Co2-based warming — that in fact some or much of the warming we ascribe to Co2 is actually due to this heat island effect in areas where we have measurement stations.

My son and I quantified the Phoenix urban heat island years ago in this project.

I am still wondering why Phoenix doesn’t investigate lighter street paving options.  They use all black asphalt, and just changing this approach (can you have lighter asphalt?) would be a big help.  By the way, our house is all white with a white foam roof, so we are doing our part to fight the heat island!

Ocean Acidification

In the past, I have responded to questions at talks I have given on ocean acidification with an “I don’t know.”  I hadn’t studied the theory and didn’t want to knee-jerk respond with skepticism just because the theory came from people who propounded a number of other theories I knew to be BS.

The theory is that increased atmospheric CO2 will result in increasing amounts of CO2 being dissolved .  That CO2 when in solution with water forms carbonic acid.  And that acidic water can dissolve the shells of shellfish.  They have tested this by dumping acid in sea water and doing so has had a negative effect on shellfish.

This is one of those logic chains that seems logical on its face, and is certainly scientific enough sounding to fool the typical journalist or concerned Hollywood star.  But the chemistry just doesn’t work this way.   This is the simplest explanation I have found, but I will take a shot at summarizing the key problem.

It is helpful to work backwards through this proposition.  First, what is it about acidic water  — actually not acidic, but “more neutral” water, since sea water is alkaline  — that causes harm to the shells of sea critters?   H+ ions in solution from the acid combine with calcium carbonate in the shells, removing mass from the shell and “dissolving” the shall.  When we say an acid “eats” or “etches” something, a similar reaction is occurring between H+ ion and the item being “dissolved”.

So pouring a beaker of acid into a bucket of sea water increases the free H+ ions and hurts the shells.  And if you do exactly that – put acid in seawater in an experiment – I am sure you would get exactly that result.

Now, you may be expecting me to argue that there is a lot of sea water and the net effect of trace CO2 in the atmosphere would not affect the pH much, especially since seawater starts pretty alkaline.  And I probably could argue this, but there is a better argument and I am embarrassed that I never saw it before.

Here is the key:  When CO2 dissolves in water, we are NOT adding acid to the water.  The analog of pouring acid into the water is a false one.  What we are doing is adding CO2 to the water, which combines with water molecules to form carbonic acid.  This is not the same as adding acid to the water, because the H+ ions we are worried about are already there in the water.  We are not adding any more.  In fact, one can argue that increasing the CO2 in the water “soaks up” H+ ions into carbonic acid and by doing so shifts the balance  so that in fact less calcium carbonate will be removed from shells.    As a result, as the link above cites,

As a matter of fact, calcium carbonate dissolves in alkaline seawater (pH 8.2) 15 times faster than in pure water (pH 7.0), so it is silly, meaningless nonsense to focus on pH.

Unsurprisingly, for those familiar with  climate, the chemistry of sea water is really complex and it is not entirely accurate to isolate these chemistries absent other effects, but the net finding is that CO2 induced thinning of sea shells seems to be based on a silly view of chemistry.

Am I missing something?  I am new to this area of the CO2 question, and would welcome feedback.

Potential Phoenix Climate Presentation

I am considering making a climate presentation in Phoenix based on my book, videos, and blogging on how catastrophic anthropogenic global warming theory tends to grossly overestimate man’s negative impact on climate.

I need an honest answer – is there any interest out there in the Phoenix area in that you might attend such a presentation in North Phoenix followed by a Q&A?  Email me or leave notes in the comments.  If you are associated with a group that might like to attend such a presentation, please email me.

More Proxy Hijinx

Steve McIntyre digs into more proxy hijinx from the usual suspects.  This is a pretty good summary of what he tends to find, time and again in these studies:

The problem with these sorts of studies is that no class of proxy (tree ring, ice core isotopes) is unambiguously correlated to temperature and, over and over again, authors pick proxies that confirm their bias and discard proxies that do not. This problem is exacerbated by author pre-knowledge of what individual proxies look like, leading to biased selection of certain proxies over and over again into these sorts of studies.

The temperature proxy world seems to have developed into a mono-culture, with the same 10 guys creating new studies, doing peer review, and leading IPCC sub-groups.  The most interesting issue McIntyre raises is that this new study again uses proxy’s “upside down.”  I explained this issue more here and here, but a summary is:

Scientists are trying to reconstruct past climate variables like temperature and precipitation from proxies such as tree rings.  They begin with a relationship they believe exists based on a physical understanding of a particular system – ie, for tree rings, trees grow faster when its warm so tree rings are wider in warm years.  But as they manipulate the data over and over in their computers, they start to lose touch with this physical reality.

…. in one temperature reconstruction, scientists have changed the relationship opportunistically between the proxy and temperature, reversing their physical understanding of the process and how similar proxies are handled in the same study, all in order to get the result they want to get.

Data Splices

Splicing data sets is a virtual necessity in climate research.  Let’s think about how I might get a 500,000 year temperature record.  For the first 499,000 years I probably would use a proxy such as ice core data to infer a temperature record.  From 150-1000 years ago I might switch to tree ring data as a proxy.  From 30-150 years ago I probably would use the surface temperature record.  And over the last 30 years I might switch to the satellite temperature measurement record.  That’s four data sets, with three splices.

But there is, obviously, a danger in splices.  It is sometimes hard to ensure that the zero values are calibrated between two records (typically we look at some overlap time period to do this).  One record may have a bias the other does not have.  One record may suppress or cap extreme measurements in some way (example – there is some biological limit to tree ring growth, no matter how warm or cold or wet or dry it is).  We may think one proxy record is linear when in fact it may not be linear, or may be linear over only a narrow range.

We have to be particularly careful at what conclusions we draw around the splices.  In particular, one would expect scientists to be very, very skeptical of inflections or radical changes in the slope or other characteristic of the data that occur right at a splice.  Occam’s Razor might suggest the more logical solution is that such changes are related to incompatibilities with the two data sets being spliced, rather than any particular change in the physical phenomena being measured.

Ah, but not so in climate.  A number of the more famous recent findings in climate have coincided with splices in data sets.  The most famous is in Michael Mann’s hockey stick, where the upward slope at the end of the hockey stick occurs exactly at the point where tree ring proxy data is spliced to instrument temperature measurements.  In fact, if looking only at the tree ring data brought to the present, no hockey stick occurs (in fact the opposite occurs in many data sets he uses).   The obvious conclusion would have been that the tree ring proxy data might be flawed, and that it was not directly comparable with instrumental temperature records.  Instead, Al Gore built a movie around it.  If you are interested, the splice issue with the Mann hockey stick is discussed in detail here.

Another example that I have not spent as much time with is the ocean heat content data, discussed at the end of this post.  Heat content data from the ARGO buoy network is spliced onto older data.  The ARGO network has shown flat to declining heat content every year of its operation, except for a jump in year one from the old data to the new data.  One might come to the conclusion that the two data sets did not have their zero’s matched well, such that the one year jump is a calibration issue in joining the data sets, and not the result of an actual huge increase in ocean heat content of a magnitude that has not been observed before or since.  Instead, headline read that the ARGO network has detected huge increases in ocean heat content!

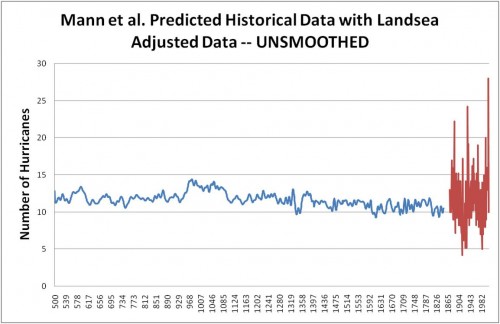
So this brings us to today’s example, probably the most stark and obvious of the bunch, and we have our friend Michael Mann to thank for that.  Mr. Mann wanted to look at 1000 years of hurricanes, the way he did for temperatures.  He found some proxy for hurricanes in years 100-1000, basically looking at sediment layers.  He uses actual observations for the last 100 years or so as reported by a researcher named Landsea  (one has to adjust hurricane numbers for observation technology bias — we don’t miss any hurricanes nowadays, but hurricanes in 1900 may have gone completely unrecorded depending on their duration and track).  Lots of people argue about these adjustments, but we are not going to get into that today.

Here are his results, with the proxy data in blue and the Landsea adjusted observations in red.  Again you can see the splice of two very different measurement technologies.

mannlandseaunsmoothed

Now, you be the scientist.  To help you analyze the data, Roger Pielke via Anthony Watt has calculated to basic statistics for the blue and red lines:

The Mann et al. historical predictions [blue] range from a minimum of 9 to a maximum of 14 storms in any given year (rounding to nearest integer), with an average of 11.6 storms and a standard deviation of 1.0 storms. The Landsea observational record [red] has a minimum of 4 storms and a maximum of 28 with and average of 11. 7 and a standard deviation of 3.75.

The two series have almost dead-on the same mean but wildly different standard deviations.  So, junior climate scientists, what did you conclude?  Perhaps:

  • The hurricane frequency over the last 1000 years does not appear to have increased appreciably over the last 100, as shown by comparing the two means.  or…
  • We couldn’t conclude much from the data because there is something about our proxy that is suppressing the underlying volatility, making it difficult to draw conclusions

Well, if you came up with either of these, you lose your climate merit badge.  In fact, here is one sample headline:

Atlantic hurricanes have developed more frequently during the last decade than at any point in at least 1,000 years, a new analysis of historical storm activity suggests.

Who would have thought it?  A data set with a standard deviation of 3.75 produces higher maximum values than a data set with the same mean but with the standard deviation suppressed down to 1.0.  Unless, of course, you actually believe that the data volatility in the underlying natural process suddenly increase several times coincidental in the exact same year as the data splice.

As Pielke concluded:

Mann et al.’s bottom-line results say nothing about climate or hurricanes, but what happens when you connect two time series with dramatically different statistical properties. If Michael Mann did not exist, the skeptics would have to invent him.

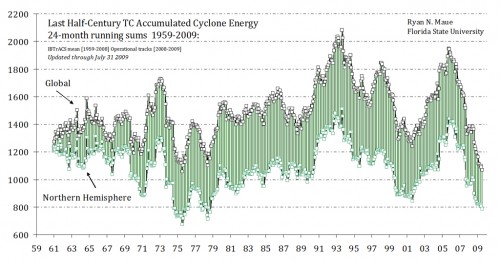
Postscript #1: By the way, hurricane counts are a horrible way to measure hurricane activity (hurricane landfalls are even worse).  The size and strength and duration of hurricanes are also important.  Researchers attempt to factor these all together into a measure of accumulated cyclone energy.  This metric of world hurricanes and cyclones has actually be falling the last several years.

global_running_ace2

Postscript #2: Just as another note on Michael Mann, he is the guy who made the ridiculously overconfident statement that “there is a 95 to 99% certainty that 1998 was the hottest year in the last one thousand years.”   By the way, Mann now denies he ever made this claim, despite the fact that he was recorded on video doing so.  The movie Global Warming:  Doomsday Called Off has the clip.  It is about 20 seconds into the 2nd of the 5 YouTube videos at the link.

Evan Mills Response to My Critique of the Grid Outage Chart

A month or two ago, after Kevin Drum (a leftish supporter of strong AGW theory) posted a chart on his site that looked like BS to me.  I posted my quick reactions to the chart here, and then after talking to the data owner in Washington followed up here.

The gist of my comments were that the trend in the data didn’t make any sense, and upon checking with the data owner, it turns out much of the trend is due to changes in the data collection process.  I stick by that conclusion, though not some of the other suppositions in those posts.

I was excited to see Dr. Mills response (thanks to reader Charlie Allen for the heads up).  I will quote much of it, but to make sure I can’t be accused of cherry-picking, here is his whole post here.  I would comment there, but alas, unlike this site, Dr. Mills chooses not to allow comments.

So here we go:

Two blog entries [1-online | PDF] [2-online | PDF] [Accessed June 18, 2009] mischaracterize analysis in a new report entitled Global Climate Change Impacts in the United States. The blogger (a self-admitted “amateur”) created a straw man argument by asserting that the chart was presented as evidence of global climate change and was not verified with the primary source. The blog’s errors have been propagated to other web sites without further fact checking or due diligence. (The use of profanity in the title of the first entry is additionally unprofessional.)

Uh, oh, the dreaded “amateur.”  Mea Culpa.  I am a trained physicist and engineer.  I don’t remember many colleges handing out “climate” degrees in 1984, so I try not to overstate my knowledge.  As to using “bullsh*t” in the title, the initial post was “I am calling bullsh*t on this chart.”  Sorry, I don’t feel bad about that given the original post was a response to a post on a political blog.

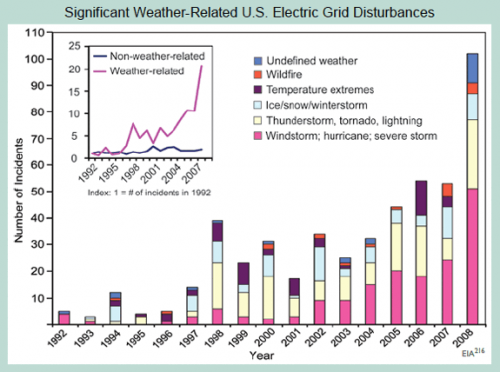
The underlying database—created by the U.S. Department of Energy’s Energy Information Administration—contains approximately 930 grid-disruption events taking place between 1992 and 2008, affecting 135 million electric customers.

As noted in the caption to the figure on page 58 of our report (shown above)—which was masked in the blogger’s critique—

First, I am happy to admit errors where I make them (I wonder if that is why I am still an “amateur”).   It was wrong of me to post the chart without the caption. My only defense was that I copied the chart from, and was responding to its use on, Kevin Drum’s site and he too omitted the caption. I really was not trying to hide what was there.   I am on the road and don’t have the original but here it is from Dr. Mills’ post.
grid-disturbances-chart

grid-disturbances-text

Anyway, to continue…

As noted in the caption to the figure on page 58 of our report (shown above)—which was masked in the blogger’s critique—we expressly state a quite different finding than that imputed by the blogger, noting with care that we do not attribute these events to anthropogenic climate change, but do consider the grid vulnerable to extreme weather today and increasingly so as climate change progresses, i.e.:

“Although the figure does not demonstrate a cause-effect relationship between climate change and grid disruption, it does suggest that weather and climate extremes often have important effects on grid disruptions.”

The associated text in the report states the following, citing a major peer-reviewed federal study on the energy sector’s vulnerability to climate change:

“The electricity grid is also vulnerable to climate change effects, from temperature changes to severe weather events.”

To Dr. Mills’ point that I misinterpreted him — if all he wanted to say was that the electrical grid could be disturbed by weather or was vulnerable to climate change, fine.  I mean, duh.  If there are more tornadoes knocking about, more electrical lines will come down.  But if that was Dr. Mills ONLY point, then why did he write (emphasis added):

The number of incidents caused by extreme weather has increased tenfold since 1992.  The portion of all events that are caused by weather-related phenomena has more than tripled from about 20 percent in the early 1990s to about 65 percent in recent years.  The weather-related events are more severe…

He is saying flat out that the grid IS being disturbed 10x more often and more severely by weather.  It doesn’t even say “reported” incidents or “may have” — it is quite definitive.  So which one of us is trying to create a straw man?   It is these statements that I previously claimed the data did not support, and I stand by my analysis on that.

And it’s not like there is some conspiracy of skeptics to mis-interpret Mr. Mills.  Kevin Drum, a  huge cheerleader for catastrophic AGW, said about this chart:

So here’s your chart of the day: a 15-year history of electrical grid problems caused by increasingly extreme weather.

I will skip the next bit, wherein it appears that Dr. Mills is agreeing with my point that aging and increased capacity utilization on the grid could potentially increase weather-related grid outages without any actual change in the weather  (just from the grid being more sensitive or vulnerable)

OK, so next is where Mr. Mills weighs in on the key issue of the data set being a poor proxy, given the fact that most of the increase in the chart are due to better reporting rather than changes in the underlying phenomenon:

The potential for sampling bias was in fact identified early-on within the author team and—contrary to the blogger’s accusation—contact was in fact made with the person responsible for the data collection project at the US Energy Information Administration on June 10, 2008 (and with the same individual the blogger claims to have spoken to). At that time the material was discussed for an hour with the EIA official, who affirmed the relative growth was in weather-related events and that it could not be construed as an artifact of data collection changes, etc. That, and other points in this response, were re-affirmed through a follow up discussion in June 2009.

In fact, the analysis understates the scale of weather-related events in at least three ways:

  • EIA noted that there are probably a higher proportion of weather events missing from their time series than non-weather ones (due to minimum threshold impacts required for inclusion, and under-reporting in thunderstorm-prone regions of the heartland).
  • There was at least one change in EIA’s methodology that would have over-stated the growth in non-weather events, i.e., they added cyber attacks and islanding in 2001, which are both “non-weather-related”.
  • Many of the events are described in ways that could be weather-related (e.g. “transmission interruption”) but not enough information is provided. We code such events as non-weather-related.

Dr. Mills does not like me using the “BS” word, so I will just say this is the purest caca. I want a single disinterested scientist to defend what Dr. Mills is saying. Remember:

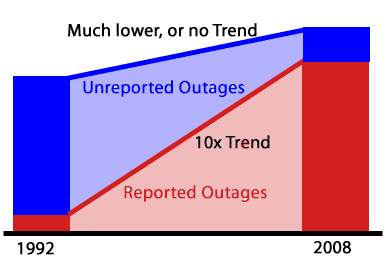
  • Prior to 1998, just about all the data is missing. There were pushes in 2001 and 2008 to try to fix under reporting.  Far from denying this, Dr. Mills reports the same facts.  So no matter how much dancing he does, much of the trend here is driven by increased reporting, not the underlying phenomenon.  Again, the underlying phenomenon may exist, but it certainly is not a 10x increase as reported in the caption.
  • The fact that a higher proportion of the missing data is weather-related just underlines the point that the historic weather-related outage data is a nearly meaningless source of trend data for weather-related outages.
  • His bullet points are written as if the totals matter, but the point of the chart was never totals.  I never said he was overstating weather related outages today.   The numbers in 2008 may still be (and probably are) understated.  And I have no idea even if 50 or 80 is high or low,  so absolute values have no meaning to me anyway.  The chart was designed to portray a trend — remember that first line of the caption “The number of incidents caused by extreme weather has increased tenfold since 1992. ” — not a point on absolute values.   What matters is therefore not how much is missing, but how much is missing in the early years as compared to the later years.
  • In my original post I wrote, as Dr. Mills does, that the EIA data owner thinks there is a weather trend in the data if you really had quality data.  Fine.  But it is way, way less of a trend than shown in this chart.  And besides, when did the standards of “peer reviewed science” stoop to include estimates of government data analysts as to what the trend in the data would be if the data weren’t corrupted so badly.   (Also, the data analyst was only familiar with the data back to 1998 — the chart started in 1992.
  • Dr. Mills was aware that the data had huge gaps before publication.  Where was the disclosure?  I didn’t see any disclosure.  I wonder if there was such disclosure in the peer reviewed study that used this data (my understanding is that there must have been one, because the rules of this report is that everything had to come from peer-reviewed sources).
  • I don’t think any reasonable person could use this data set in a serious study knowing what the authors knew.  But reasonable people can disagree, though I will say that I think there is no ethical way anyone could have talked to the EIA in detail about this data and then used the 1992-1997 data.

Onward:

Thanks to the efforts of EIA, after they took over the responsibility of running the Department of Energy (DOE) data-collection process around 1997, it became more effective. Efforts were made in subsequent years to increase the response rate and upgrade the reporting form.

Thanks, you just proved my point about the trend being driven by changes in reporting and data collection intensity.

To adjust for potential response-rate biases, we have separated weather- and non-weather-related trends into indices and found an upward trend only in the weather-related time series.

As confirmed by EIA, if there were a systematic bias one would expect it to be reflected in both data series (especially since any given reporting site would report both types of events).

As an additional precaution, we focused on trends in the number of events (rather than customers affected) to avoid fortuitous differences caused by the population density where events occur. This, however, has the effect of understating the weather impacts because of EIA definitions (see survey methodology notes below).

Well, its possible this is true, though unhappily, this analysis was not published in the original report and was not published in this post.   I presume this means he has a non-weather time series that is flat for this period.  Love to see it, but this is not how the EIA portrayed the data to me.  But it really doesn’t matter – I think the fact that there is more data missing in the early years than the later years is indisputable, and this one fact drives a false trend.

But here is what I think is really funny- — the above analysis does not matter, because he is assuming a reporting bias symmetry, but just  a few paragraphs earlier he stated that there was actually an asymmetry.  Let me quote him again:

EIA noted that there are probably a higher proportion of weather events missing from their time series than non-weather ones (due to minimum threshold impacts required for inclusion, and under-reporting in thunderstorm-prone regions of the heartland).

Look Dr. Mills, I don’t have an axe to grind here.  This is one chart out of bazillions making a minor point.  But the data set you are using is garbage, so why do you stand by it with such tenacity?  Can’t anyone just admit “you know, on thinking about it, there are way to many problems with this data set to declare a trend exists.  Hopefully the EIA has it cleaned up now and we can watch it going forward.”  But I guess only “amateurs” make that kind of statement.

The blogger also speculated that many of the “extreme temperature” events were during cold periods, stating “if this is proof of global warming, why is the damage from cold and ice increasing as fast as other severe weather causes?” The statement is erroneous.

This was pure supposition in my first reaction to the chart.  I later admitted that I was wrong.  Most of the “temperature” effects are higher temperature.  But I will admit it again here – that supposition was incorrect.  He has a nice monthly distribution of the data to prove his point.

I am ready to leave this behind, though I will admit that Dr. Mills response leaves me more rather than less worried about the quality of the science here.  But to summarize, everything is minor compared to this point:  The caption says “The number of incidents caused by extreme weather has increased tenfold since 1992.”  I don’t think anyone, knowing about the huge underreporting in early years, and better reporting in later years, thinks that statement is correct.  Dr. Mills should be willing to admit it was incorrect.

Update: In case I am not explaining the issue well, here is a conceptual drawing of what is going on:
trend

Update #2: One other thing I meant to post.  I want to thank Dr. Mills — this is the first time in quite a while I have received a critique of one of my posts without a single ad hominem attack, question about my source of funding, hypothesized links to evil forces, etc.  Also I am sorry I wrote “Mr.” rather than “Dr.” Mills.  Correction has been made.

Warm Weather and Prosperity

I get it that a 15F increase in global temperatures would not be good for agriculture.  Of course, I think 15F is absurd, at least from anthropogenic CO2.

However, for the types of warming we are seeing (in the tenths of a degree), such warming has always been a harbinger of prosperity through history.  The medieval warm period in Europe was a time of expanding populations driven by increasing harvests.  When the medieval warm period ended and decades of cooler weather ensued, the Great Famine resulted — a famine which many blame for weakening the population and making later plague outbreaks more severe.

I read a lot of history, and take a number of history courses (both on tape and live).  Its so funny when the professor gets to these events, because she/he always has to preface his remarks with “I know you have been tought that warming is universally bad, but…”

2009 may rank as a below average year for American agriculture, not because of heat, but because of late frosts and an unusually cool summer.

Do Arguments Have to Be Symmetric?

I am looking at some back and forth in this Flowing Data post.

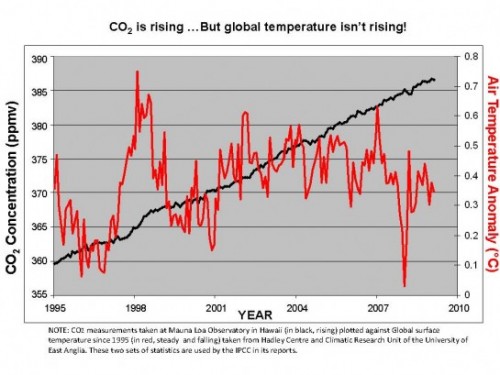
Apparently an Australian Legislator named Stephen Fielding posted this chart and asked, “Is it the case that CO2 increased by 5% since 1998 whilst global temperature cooled over the same period (see Fig. 1)?  If so, why did the temperature not increase; and how can human emissions be to blame for dangerous levels of warming?”

the_global_temperature_chart-545x409

Certainly this could sustain some interesting debate.  Climate is complex, so their might be countervailing effects to CO2, but it also should be noted that none of the models really predicted this flatness in temperatures, so it certainly could be described as “unexpected” at least among the alarmist community.

Instead, the answer that came back from Stephen Few was this (as reported by Flowing Data, I cannot find this on Few’s site):

This is a case of someone who listens only to what he wants to hear (the arguments of a few fringe organizations with agendas) and either ignores or is incapable of understanding the overwhelming weight of scientific evidence. He selected a tiny piece of data (a short period of time, with only one of many measures of temperature), misinterpreted it, and ignored the vast collection of data that contradicts his position. This fellow is either incredibly stupid or a very bad man.

Every alarmist from Al Gore to James Hansen has used this same chart in their every presentation – showing global temperatures since 1950  (or really since 1980) going up in lockstep with Co2.  This is the alarmists #1 chart.  All Fielding has done is shown data after 1998, something alarmists tend to be reluctant to do.  Sure it’s a short time period, but nothing in any alarmist prediction or IPCC report hinted that there was any possibility that for even so short a time as 15 years warming might cease  (at least not in the last IPCC report, which I have read nearly every page of).  So, by using the alarmists’ own chart and questioning a temperature trend that went unpredicted, Fielding is “either incredibly stupid or a very bad man.”  Again, the alarmist modus operandi – it is much better to smear the person in ad hominem attacks than deal with his argument.

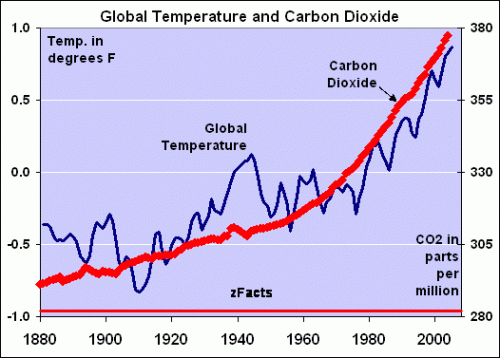
Shouldn’t there be symmetry here?  If it is OK for every alarmist on the planet to show 1980-1995 temperature growing in lockstep with CO2 as “proof” of a relationship, isn’t it equally OK to show 1995-2010 temperature not growing in lockstep with CO2 to question the relationship?  Why is one ok but the other incredibly stupid and/or mean-spirited?   I mean graphs like this were frequent five years ago, though they have dried up recently:

zfacts-co2-temp

For extra credit, figure out how they got most of the early 2000’s to be warmer than 1998 in this chart, since I can find no major temperature metric that matches this.  I suspect some endpoint smoothing games here.

I won’t get into arguing the “overwhelming weight of scientific evidence” statement, as I find arguments over counting scientific heads or papers to be  useless in the extreme.  But I will say that as a boy when I learned about the scientific method, there was a key step where one’s understanding of a natural phenomenon is converted into predicted behaviors, and then those predictions are tested against reality.  All Fielding is doing is testing the predictions, and finding them to be missing the mark.  Sure, one can argue that the testing period has not been long enough, so we will keep testing, but what Fielding is trying to do here, however imperfectly, is perfectly compatible with the scientific method.

I must say I am a bit confused about those “many other measures of temperature.”  Is Mr. Few suggesting that the chart would have different results in Fahrenheit?  OK, I am kidding of course.  What I am sure he means is that there are groups other than the Hadley Center that produce temperature records for the globe  (though in Mr. Fielding’s defense the Hadley Center is a perfectly acceptable source and the preferred source of much of the IPCC report).  To my knowledge, there are four major metrics (Hadley, GISS, UAH, RSS).  Of these four, at least three (I am not sure about the GISS) would show the same results.  I think the “overwhelming weight” of temperature metrics makes the same point as Mr. Fielding’s chart.

In the rest of his language, Few is pretty sloppy for someone who wants to criticize someone for sloppiness.  He says that Fielding “misinterpreted” the temperature data.  How?  Seems straight forward to me.  He also says that there is a “vast collection of data that contradicts his position.”  What position is that?  If his position is merely that Co2 has increased for 15 years and temperatures have not, well, there really is NOT a vast collection of data that contradicts that.  There may be a lot of people who have published reasons whythis set of facts does not invalidate AGW, but the facts are still the same.

By the way, I get exhausted by the accusation that skeptics are somehow simplistic and can’t understand complex systems.    I feel like my understanding is pretty nuanced. By the way, its interesting how the sides have somewhat reversed here.  When temperature was going up steadily, it was alarmists saying that things were simple and skeptics saying that climate was complex and you couldn’t necessarily make the 1:1 correlation between CO2 and temperature increases.  Now that temperature has flat lined for a while, it is alarmists screaming that skeptics are underestimating the complexity.  I tend to agree — climate is indeed really really complex, though I think if one accepts this complexity it is hard to square with the whole “settled science” thing.  Really, we have settled the science in less than 20 years on perhaps the most complex system we have ever tried to understand?

The same Flowing Data post references this post from Graham Dawson.  Most of Dawson’s “answers” to Fieldings questions are similar to Few’s, but I wanted to touch on one or two other things.

First, I like how he calls findings from the recent climate synthesis report the “government answer” as if this makes it somehow beyond dispute.  But I digress.

The surface air temperature is just one component in the climate system (ocean, atmosphere, cryosphere). There has been no material trend in surface air temperature during the last 10 years when taken in isolation, but 13 of the 14 warmest years on record have occurred since 1995. Also global heat content of  the ocean (which constitutes 85% of the total warming) has continued to rise strongly in this period, and ongoing warming of the climate system as a whole is supported by a very wide range of observations, as reported in the peer-reviewed scientific literature.

This is the kind of blithe answer that is full of inaccuracies everyone needs to be careful about.  The first sentence is true, and the second is probably close to the mark, though with a bit more uncertainty than he implies.  He is also correct that global heat content of the ocean is a huge part of warming or the lack thereof, but his next statement is not entirely correct.  Ocean heat content as measured by the new ARGO system since 2003 has been flat to down.  Longer term measures are up, but most of the warming comes at the point the old metrics were spliced to the ARGO data, a real red flag to any serious data analyst.  The cryospehere is important as well, but most metrics show little change in total sea ice area, with losses in the NH offset by gains in the SH.

While the Earth’s temperature has been warmer in the geological past than it is today, the magnitude and rate of change is unusual in a geological context. Also the current warming is unusual as past changes have been triggered by natural forcings whereas there are no known natural climate forcings, such as changes in solar irradiance, that can explain the current observed warming of the climate system. It can only be explained by the increase in greenhouse gases due to human activities.

No one on Earth has any idea if the first sentence is true — this is pure supposition on the author’s part, stated as a fact.  We are talking about temperature changes today over a fifty year (or shorter) period, and we have absolutely no way to look at changes in the “geological past” on this fine of a timescale.  I am reminded of the old ice core chart that was supposedly the smoking gun between CO2 and temperature, only to find later as we improved the time resolution that temperature increases came before Co2 increases.

I won’t make too much of my usual argument on the sun, except to say that the Sun has been substantially more active during the warming period of 1950-2000 than it has been in other times.  What I want to point out, though, is the core foundation of the alarmist argument, one that I have pointed out before.  It boils down to:  Past warming must be due to man because we can’t think of what else it could be.   This is amazing hubris, representing a total unwillingness to admit what we do and don’t understand.  Its almost like the ancient Greeks, attributing what they didn’t understand in the cosmos to the hijinx of various gods.

It is not the case that all GCM computer models projected a steady increase in temperature for the period 1990-2008.  Air temperatures are affected by natural variability.  Global Climate Models show this variability in the long term but are not able to predict exactly when such variations will happen. GCMs can and do simulate decade-long periods of no warming, or even slight cooling, embedded in longer-term warming trends.

But none showed zero warming, or anything even close.

So Why Bother?

I just watched Peter Sinclair’s petty little video on Anthony Watt’s effort to survey and provide some level of quality control on the nation’s surface temperature network.  Having participated in the survey, I was going to do a rebuttal video from my own experience, but I just don’t have the time, but I want to offer a couple of quick thoughts.

  • Will we ever see an alarmist be able to address any skeptics critique of AGW science without resorting to ad hominem attacks?  I guess the whole “oil industry funding” thing is a base requirement for any alarmist article, but this guy really gets extra credit for the tobacco industry comparison.  Seriously, do you guys really think this addresses the issue?
  • I am fairly sure that Mr. Watt would not deny that the world has warmed over the last 100 years, though he might argue that warming has been exaggerated somewhat.  Certainly satellites are immune to the biases and problems Mr. Watt’s group is identifying, and they still show warming  (though less than the surface temperature networks is showing).
  • The video tries to make Watt’s volunteers sound like silly children at camp, but in fact weather measurement and data collection in this country have a long history of involvement and leadership by volunteers and amateurs.
  • The core point that really goes unaddressed is that the government, despite spending billions of dollars on AGW-related projects, is investing about zero in quality control of the single most critical data set to the current public policy decisions.   Many of the sites are absolutely inexcusable, EVEN against the old goals of reporting weather rather than measuring climate change.  I surveyed the Tucson site – it is a joke.
  • Mr. Sinclair argues that the absolute value of the temperatures does not matter as much as their changes over time.  Fine, I would agree.  But again, he demonstrates his ignorance.  This is an issue Anthony and most of his readers discuss all the time.  When, for example, we talk about the really biased site at Tucson, it is always in the context of the fact that 100 years ago Tucson was a one horse town, and so all the urban heat biases we might find in a badly sited urban location have been introduced during the 20th century measurement period.  These growing biases show up in the measurements as increasing temperatures.  And the urban heat island effects are huge.  My son and I personally measured about 10F in the evening.  Even if this was only at Tmin, and was 0 effect at Tmax  (daily average temps are the average of Tmin and Tmax) then this would still introduce a bias of 5F today that was surely close to zero a hundred years ago.
  • Mr. Sinclair’s knowledge about these issues is less than one of our readers might have had 3 years ago.  He says we should be satisfied with the data quality because the government promises that it has adjusted for these biases.  But these very adjustments, and the inadequacy of the process, is one reason for Mr. Watt’s efforts.  If Mr. Sinclair had bothered to educate himself, he would know that many folks have criticized these adjustments because they are done blind, without any reference to actual station quality or details, by statistical processes.  But without the knowledge of which stations have better installations, the statistical processes tend to spread the bias around like peanut butter, rather than really correct for it, as demonstrated here for Tucson and the Grand Canyon (both of these stations I have personally visited).
  • The other issue one runs into in trying to correct for a bad site through adjustments is the signal to noise problem.  The world global warming signal over the last 100 years has been no more than 1 degree F.  If urban heat biases are introducing a 5,8, or 10 degree bias, then the noise, and thus the correction factor, is 5-10 times larger than the signal.   In practical terms, this means a 10-20% error in the correction factor can completely overwhelm the signal one is trying to detect.  And since most of the correction factors are not much better than educated guesses, their errors are certainly higher than this.
  • Overall Mr. Sinclair’s point seems to be that the quality of the stations does not matter.  I find that incredible, and best illustrated with an example.  The government makes decisions about the economy and interest rates and taxes and hundreds of other programs based on detailed economic data.  Let’s say that instead of sampling all over Arizona, they just sampled in one location, say Paradise Valley zip code 85253.  Paradise Valley happens to be (I think) the wealthiest zip code in the state.  So, if by sampling only in Paradise Valley, the government decides that everyone is fine and no one needs any government aid, would Mr. Sinclair be happy?  Would this be “good enough?”  Or would we demand an investment in a better data gathering network that was not biased towards certain demographics to make better public policy decisions involving hundreds of billions of dollars?

Another Reason I Trust Satellite Data over Surface Data

There are a number of reasons to prefer satellite data over surface data for temperature measurement –satellites have better coverage and are not subject to site location  biases.  On the flip side, satellites only have limited history (back to 1979) so it is of limited utility for long-term analyses.  Also,they do not strictly measure the surface, but the lower troposphere (though most climate models expect these to move in tandem).  And since some of the technologies are newer, we don’t fully understand biases or errors that may be in the measurement system (though satellites are not any newer than certain surface temperature measurement devices that are suspected of biases).  In particular, sattelites are subject to some orbital drift and changes in altitude and sensor function over time that must be corrected, perhaps imperfectly to date.

To this latter point, what one would want to see is an open dialog, with a closed loop between folks finding potential problems (like this one) and folks fixing or correcting the problems.  In the case of both the UAH and RSS teams, both have been very responsive to outside criticism of their methodologies, and have improved them over time.  This stands in stark contrast to the GISS and other surface temperature teams, who resist criticism intensely, put few resources into quality control (Hansen says a quarter man year at the GISS) and who refuse to credit outsiders even when changes are made under external presure.