I wanted to pull out one thought from my longer video and presentation on global warming.
As a reminder, I adhere to what I call the weak anthropogenic theory of global warming — that the Earth’s sensitivity to CO2, net of all feedback effects, is 1C per doubling of CO2 concentrations or less, and that while man may therefore be contributing to global warming with his CO2 (not to mention his land use and other practices) the net effect falls far short of catastrophic.
While in the media, alarmists want to imply that the their conclusions about climate sensitivity are based on a century of observation, but this is not entirely true. Certainly we have over a century of temperature measurements, but only a small part of this history is consistent with the strong anthropogenic theory. In fact, I observed in my video is that the entire IPCC case for a high climate sensitivity to CO2 is based on just 20 years of history, from about 1978 to 1998.
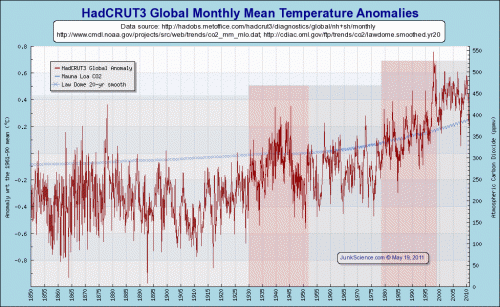
Here are the global temperatures in the Hadley CRUT3 data base, which is the primary data from which the IPCC worked (hat tip Junk Science Global Warming at a Glance) click to enlarge
Everything depends on how one counts it, but during the period of man-made CO2 creation, there are really just two warming periods, if we consider the time from 1910 to 1930 just a return to the mean.
- 1930-1952, where temperatures spiked about a half a degree and ended 0.2-0.3 higher than the past trend
- 1978-1998, where temperatures rose about a half a degree, and have remained at that level since
Given that man-made CO2 output did not really begin in earnest until after 1950 (see the blue curve of atmospheric CO2 levels on the chart), even few alarmists will attribute the runup in temperatures from 1930-1952 (a period of time including the 1930’s Dust Bowl) to anthropogenic CO2. This means that the only real upward change in temperatures that could potentially be blamed on man-made CO2 occurred from 1978-1998.
This is a very limited amount of time to make sweeping statements about climate change causation, particularly given the still infant-level knowledge of climate science. As a result, since 1970, skeptics and alarmists have roughly equal periods of time where they can make their point about temperature causation (e.g. 20 years of rising CO2 and flat temperatures vs. 20 years of rising CO2 and rising temperatures).
This means that in the last 40 years, both skeptics and alarmists must depend on other climate drivers to make their case (e.g. skeptics must point to other natural factors for the run-up in 1978-1998, while alarmists must find natural effects that offset or delayed warming in the decade either side of this period). To some extent, this situation slightly favors skeptics, as skeptics have always been open to natural effects driving climate while alarmists have consistently tried to downplay natural forcing changes.
I won’t repeat all the charts, but starting around chart 48 of this powerpoint deck (also in the video linked above) I present some alternate factors what may have contributed, along with greenhouse gases, to the 1978-1998 warming (including two of the strongest solar cycles of the century and a PDO warm period nearly exactly matching these two decades).
Postscript: Even if the entire 0.7C or so temperature increase in the whole of the 20th century is attributed to manmade CO2, this still implies a climate sensitivity FAR below what the IPCC and other alarmists use in their models. Given about 44% of a doubling since the industrial revolution began in CO2 concentrations, this would translate into a temperature sensitivity of 1.3C (not a linear extrapolation, the relationship is logarithmic).
This is why alarmists must argue that not only has all the warming we have seen been due to CO2 ( heroic assumption in and of itself) but that there are additional effects masking or hiding the true magnitude of past warming. Without these twin, largely unproven assumptions, current IPCC “consensus” numbers for climate sensitivity would be absurdly high. Again, I address this in more depth in my video.

