Update: Keith Briffa responds to the issues discussed below here.
Sorry I am a bit late with the latest hockey stick controversy, but I actually had some work at my real job.
At this point, spending much time on the effort to discredit variations of the hockey stick analysis is a bit like spending time debunking phlogiston as the key element of combustion. But the media still seems to treat these analyses with respect, so I guess the effort is necessary.
Quick background: For decades the consensus view was that earth was very warm during the middle ages, got cold around the 17th century, and has been steadily warming since, to a level today probably a bit short of where we were in the Middle Ages. This was all flipped on its head by Michael Mann, who used tree ring studies to “prove” that the Medieval warm period, despite anecdotal evidence in the historic record (e.g. the name of Greenland) never existed, and that temperatures over the last 1000 years have been remarkably stable, shooting up only in the last 50 years to 1998 which he said was likely the hottest year of the last 1000 years. This is called the hockey stick analysis, for the shape of the curve.
Since he published the study, a number of folks, most prominently Steve McIntyre, have found flaws in the analysis. He claimed Mann used statistical techniques that would create a hockey stick from even white noise. Further, Mann’s methodology took numerous individual “proxies” for temperatures, only a few of which had a hockey stick shape, and averaged them in a way to emphasize the data with the hockey stick. Further, Mann has been accused of cherry-picking — leaving out proxy studies that don’t support his conclusion. Another problem emerged as it became clear that recent updates to his proxies were showing declining temperatures, what is called “divergence.” This did not mean that the world was not warming, but did mean that trees may not be very good thermometers. Climate scientists like Mann and Keith Briffa scrambled for ways to hide the divergence problem, and even truncated data when necessary. More here. Mann has even flipped the physical relationship between a proxy and temperature upside down to get the result he wanted.
Since then, the climate community has tried to make itself feel better about this analysis by doing it multiple times, including some new proxies and new types of proxies (e.g. sediments vs. tree rings). But if one looks at the studies, one is struck by the fact that its the same 10 guys over and over, either doing new versions of these studies or reviewing their buddies studies. Scrutiny from outside of this tiny hockey stick society is not welcome. Any posts critical of their work are scrubbed from the comment sections of RealClimate.com (in contrast to the rich discussions that occur at McIntyre’s site or even this one) — a site has even been set up independently to archive comments deleted from Real Climate. This is a constant theme in climate. Check this policy out — when one side of the scientific debate allows open discussion by all comers, and the other side censors all dissent, which do you trust?
Anyway, all these studies have shared a couple of traits in common:
- They have statistical methodologies to emphasize the hockey stick
- They cherry pick data that will support their hypothesis
- They refuse to archive data or make it available for replication
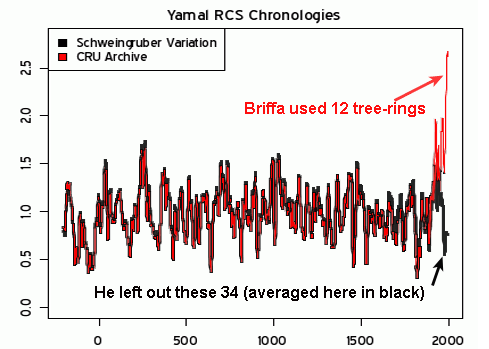
The some extent, the recent to-do about Briffa and the Yamal data set have all the same elements. But this one appears to have a new one — not only are the data sets cherry-picked, but there is growing evidence that the data within a data set has been cherry picked.
Yamal is important for the following reason – remember what I said above about just a few data sets driving the whole hockey stick. These couple of data sets are the crack cocaine to which all these scientists are addicted. They are the active ingredient. The various hockey stick studies may vary in their choice of proxy sets, but they all include a core of the same two or three that they know with confidence will drive the result they want, as long as they are careful not to water them down with too many other proxies.
Here is McIntyre’s original post. For some reason, the data set Briffa uses falls off to ridiculously few samples in recent years (exactly when you would expect more). Not coincidentally, the hockey stick appears exactly as the number of data points falls towards 10 and then 5 (from 30-40). If you want a longer, but more layman’s view, Bishop Hill blog has summarized the whole story. Update: More here, with lots of the links I didn’t have time this morning to find.
Postscript: When backed against the wall with no response, the Real Climate community’s ultimate response to issues like this is “Well, it doesn’t matter.” Expect this soon.
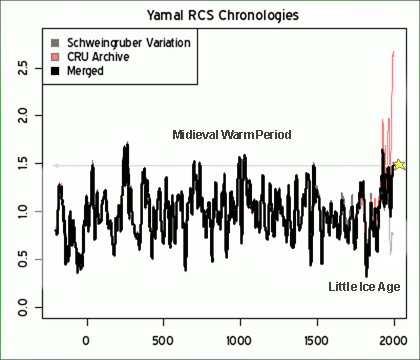
Update: Here are the two key charts, as annotated by JoNova:

And it “matters”

