Urban Bias on Surface Temperature Record

A lot of folks have started to analyze the surface temperature record for urban biases.  This site has linked a number of past analyses, and I’ve done some first-hand analysis of local surface temperature stations and measurements of the Phoenix urban heat island.  My hypothesis is that as much as half of the historic warming signal of 0.7C or so in the surface temperature record is actually growing urban heat islands biasing measurement stations.

Edward Long took a selection of US measurement points from the NCDC master list and chose 48 rural and 48 urban locations (one for each of the lower-48 states).  While I would like to see a test to ensure no cherry-picking went on, his results are pretty telling:

Station Set
oC/Century, 11-Year Average Based on the Use of
Raw Data
Adjusted Data
Rural (48)
0.11
0.58
Urban (48)
0.72
0.72
Rural + Urban (96)
0.47
0.65

More at Anthony Watt, who has this chart from the study:

The Reference Frame has more analysis as well.

If this data is representative of the whole data set, we see two phenomena that should not be news to readers of this site:

  • Inclusion of biased urban data points may be contributing as much as 5/6 of the warming signal in the test period
  • The homogenization and adjustment process, which is supposed to statistically correct for biases, seems to be correcting the wrong way, increasing clean sites to matched biased ones rather than vice versa  (something I discussed years ago here)

The homogenization process has always bothered me.  It is probably the best we can do if we don’t know which of two conflicting measurements are likely to be biased, but it makes no sense in this case, as we have a fair amount of confidence the rural location is likely better than the urban.

Let’s say you had two compasses to help you find north, but the compasses are reading incorrectly.  After some investigation, you find that one of the compasses is located next to a strong magnet, which you have good reason to believe is strongly biasing that compass’s readings.  In response, would you

  1. Average the results of the two compasses and use this mean to guide you, or
  2. Ignore the output of the poorly sited compass and rely solely on the other unbiased compass?

Most of us would quite rationally choose #2.

Most climate data bases go with approach #1.

Let’s remind everyone why this matters:  We are not going to eliminate past warming.  The Earth was at one of its coldest periods in 5000 years through about 1800 and it has gotten warmer since.   The reason it matter is twofold:

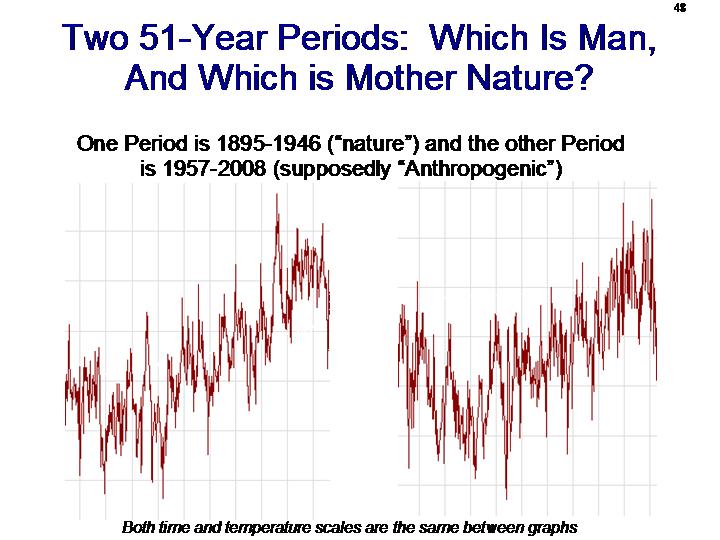
  • The main argument for anthropogenic causes of warming is that the rise of late (particularly 1978 – 1998)  has been so steep and swift that it couldn’t be anything else.  This was always an absurd argument, because we have at least two periods in the last 150 years prior to most of our fossil fuel combustion where temperature rises were as fast and steep as 1978-1998.  But if temperatures did not rise as much as we thought, this argument is further gutted.
  • High sensitivity climate models have always had trouble back-casting history.  Models that predict 5C of warming with a doubling have a difficult time replicating past warming of 0.6C for 40% of a doubling.  If the 0.6C is really 0.3C, then someone might actually raise their hand and observe that the emperor has not clothes – ie, that based on history, high sensitivity models make no sense.

Where’s Warren?

Two forces are at work that have, as judging from my email, left my readers confused.  The first is the pace of news around climate has accelerated by a factor of at least 10 since the CRU email release.  I must admit I really underestimated the impact that release would have — not in how much we would learn, but the impact it had on the media.  Suddenly, the media had a narrative they understood (coverup and malfeasance) that somehow allowed them to question catastrophic global warming theory when they were unwilling to do so on the basis of flaws in the science.   S0, for example, while the media was unwilling to question the obvious absurdity of the Himalayan glacier forecast in a straight up science discussion, they were able to run with it as a story about organizational failure at the IPCC.  Whatever.

At the same time, I have had less time to dedicate to this blog  (for those who have not seen it, my appearance on Glenn Beck may explain why).

I will continue to do science-based stories on this site as I have done in the past, but cannot possibly keep up with the evolving political stories surrounding climate change.

Weird

What an odd world we live in when environmental activists feel the need to write about how horrible grass and open parks can be for the environment.

You may recently have come to accept that lawns are bad for the planet.

Isn’t it amazing someone can assume his readers accept this statement so much that he can use it as a starting point?  He goes on to discuss when public spaces are and are not bad for the environment.

It is incredible to me that somehow we have reached a world where absurdly dense urban living a la Manhattan is considered the most environmentally friendly way for humans to live.  All just another way in which an obsession with CO2 has corrupted the environmental movement.  I have predicted it before but will say it again — some day, the environmentalists will look back on their global warming hysteria as a couple of lost decades in their own movement, when focus on real environmental issues were kicked to the curb in favor of going all in on trace concentrations of carbon dioxide.

Water Vapor Feedback

In most all of the climate models, the warming effect from feedback is actually much larger than the warming effect from CO2 alone.   That is why I have said for years that it is a waste of time to debate “greenhouse gas theory” as the real theory that matters to the proposition that climate sensitivity to CO2 is high is the theory that Earth’s temperature system is dominated by strong positive feedback.  And the largest feedback in climate models tends to be water vapor feedback, despite the fact that even the IPCC admits that such feedback is poorly understood.  To this end:

In a third paper, accepted for publication by the Journal of Theoretical and Applied Climatology, three scientists – two Australians and one American, revisit data on upper-atmospheric humidity. The three are Garth Paltridge, Albert Arking and Michael Pook, and they have found that, contrary to climate model predictions, water vapour in the upper atmosphere is acting as a brake on global warming.

Established climate models assume constant humidity at all levels in the atmosphere as the temperature rises. But, using data from weather balloons accumulated over 35 years, these researchers find this is not so. At the lower levels, it is higher than expected, dropping below normal at the higher altitudes.

This, they say, implies that “long-term water vapour feedback is negative – that it would reduce rather than amplify the response of the climate system to external forcing such as that from increasing atmospheric CO2.” This, in one fell swoop, challenges the central premise of the warmists that, once CO2 reaches a certain level, we experience runaway global warming.

Its a Floor Wax and A Desert Topping

It is not hard to find juxtapositions of news articles with the media blaming man-made global warming for two contradictory effects – e.g. more snow / less snow.  But this is one of the most stark, with articles within a year of each other blaming global warming for both more and less fog in San Francisco.  When the global warming fear finally collapses, I think the lesson that will be retained by future activitsts will be this “heads I win, Tails you lose” form of alarmism.

Interesting Potential Analog

Glenn Reynolds brings an interesting example of post-modernist science, where getting the right answer is more important than being factually correct:

Bellesiles, for those who don’t remember, was a historian at Emory who wrote a book making some, er, counterintuitive claims about guns in early America — in short, that they were much rarer than generally thought, and frequently owned and controlled by the government. Constitutional law scholars who expressed doubts about this were told to shut up by historians, who cited the importance of “peer review” as a guarantor of accuracy, and who wrapped themselves in claims of professional expertise.

Unfortunately, it turned out that Bellesiles had made it up. His work was based on probate records, and when people tried to find them, it turned out that many didn’t exist (one data set he claimed to have used turned out, on review, to have been destroyed in the 1906 San Francisco earthquake). It also turned out that Bellesiles hadn’t even visited some of the archives he claimed to have researched. When challenged to produce his data, he was unable to do so, and offered unpersuasive stories regarding why.

Bellesiles eventually lost his job at Emory (and his Bancroft Prize) over the fraud, but not until his critics had been called political hacks, McCarthyites, and worse. But what’s amazing, especially in retrospect, is how slow his defenders — and the media — were to engage the critics, or to look at the flaws in the data. Instead, they wrapped themselves in claims of authority, and attacked the critics as anti-intellectual hacks interested only in politics. Are we seeing something similar with regard to ClimateGate? It sure looks that way to me.

Phil Jones Interview

I am a bit late on this (I have family over for the weekend) but on the off chance you have not seen it, make sure to check out the notes from the interview of Phil Jones of the CRU.  Here is the BBC Q&A.    Anthony Watt has as good a summary as anyone.

Anthony summarizes as follows:

Specifically, the Q-and-As confirm what many skeptics have long suspected:

  • Neither the rate nor magnitude of recent warming is exceptional.
  • There was no significant warming from 1998-2009. According to the IPCC we should have seen a global temperature increase of at least 0.2°C per decade.
  • The IPCC models may have overestimated the climate sensitivity for greenhouse gases, underestimated natural variability, or both.
  • This also suggests that there is a systematic upward bias in the impacts estimates based on these models just from this factor alone.
  • The logic behind attribution of current warming to well-mixed man-made greenhouse gases is faulty.
  • The science is not settled, however unsettling that might be.
  • There is a tendency in the IPCC reports to leave out inconvenient findings, especially in the part(s) most likely to be read by policy makers.

I think some of these conclusions are a bit of a reach from the Q&A. I don’t get the sense that Jones is abandoning the basic hypothesis that climate sensitivity to manmade CO2 is high (e.g. 3+ degrees per doubling, rather than <=1 degrees as many skeptics would hypothesize).  In particular, I think the writing has been on the wall for a while that alarmists were bailing on the hockey stick / MWP-related arguments as indicative of high sensitivities.

The new news for me was the admission that the warming rate from 1979-present is in no way unprecedented.  This is important as the lead argument (beyond black box “the models say so” justifications) for blaming anthropogenic factors for recent warming is that the rate of warming was somehow unprecedented.  However, Jones admits (as all rational skeptics have said for some time) that the warming rate from 1979 to today is really no different than we have measured in other periods decidedly unaffected by CO2.

I have made this argument before here, with the following chart:

slide48

Again, from Anthony:

Period Length Trend
(Degrees C per decade)
Significance
1860-1880 21 0.163 Yes
1910-1940 31 0.15 Yes
1975-1998 24 0.166 Yes
1975-2009 35 0.161 Yes

Here, by the way, was my attempt to explain the last 100 years of temperature with a cyclical wave plus a small linear trend (my much more transparent and simple climate model)

slide53

Not bad, huh?  Here is a similar analysis using a linear trend plus the PDO

slide54

Reconciling Different Conclusions

One of my pet peeves in the climate debate is how some folks will immediately describe differences in opinion or interpretation to the fact that someone is lying.  I wanted to show an example of how reasonable people can disagree from the same data set.  This is from a paper written by Vincent Gray (spsl3) in response to an analysis of South Seas sea levels in a series of SEAFRAME reports here.  Mr. Gray believes the authors of the reports have exaggerated sea level rise, and I am sympathetic to his analysis, but I really wanted to show how multiple people can draw different conclusions from the same data.

To begin, lets take the sea level data for Tuvalu from here.  We will graph the raw data, and use Excel to plot a least squares linear fit (the scale on the left is in meters)

sl1

The trend we get is about 5.2mm per year of sea level rise  — the actual study Gray is commenting on shows 6mm per year, but its data only went through 2008.

The most noticeable feature on this chart is the depression in 1998, which Gray attributes to the super strong el Nino of that year.  So, I first took this anomalous data out by pasting in data for that period from a previous period (with the months synchronized)

sl2

OK, this cut the sea level trend in half, to 2.7mm a year.  Of course, this kind of data fill-in leaves much to be desired.  It was simply an experiment on my part.   I think a better test is to look at the trend since this anomalous event

sl3

The trend since the 1998 el Nino has been 0.6mm a year.

So, from the same data, we can reach trends that are an order of magnitude different, from 0.6mm to 5.4mm.  I think the original authors of the study were remiss in not doing more sensitivity analysis, and it would be an interesting test to see if presented with such an anomaly that reduced rather than increased the trend, whether they would have handled it the same way.

Never-the-less, I hope you can see why even reasonable people can draw different conclusions from the same data set.  Thanks to a reader for sending me the original link.

Of Distributions and Means

Weather is a chaotic stochastic system.  Outcomes that we typically like to measure – severe storms, tornadoes, hurricanes, temperatures, snowfall — all have mean or average behavior with a large bell-curve or normal distribution around that mean.

With all the talk of record snow in Washington or light snowfall in certain Olympic venues, I feel that a reminder is in order:  There is very little one can deduce about changes or drift in the mean from one or two isolated events in the tail ends of the distribution.   If a kid in your high school gets a perfect score on her SAT, does this mean that the average kid is getting higher SAT scores, that this kid’s score is a symptom of “global smartening?”  Or is this kid’s performance just an isolated event in the tail of the test score distribution?   Katrina and the Washington blizzard seem to occasion a lot of climate conclusions, when in fact I think those conclusions are virtually impossible from such events.

The only really useful role I can see that these extreme events play in the scientific debate is to weed out the credible climate commentators from the charlatans.    If an alarmist says, for example, that the heavy snows in Washington are not necessarily inconsistent with global warming, then he or she is probably relatively safe.  But run away quickly from anyone who says manmade CO2 caused Katrina or, even more incredibly, the Washington snowstorms — they are just nuts.

Of course, the argument typically morphs into folks arguing that extreme events themselves are more prevalent, in other words somehow the standard deviation of the distribution has expanded.  This, in my mind, is one of the weakest arguments in the alarmist arsenal.  The evidence for this is extremely weak (example), and a number of metrics (such as for hurricane activity and large tornadoes) have actually declines over the last decade.  What tends to happen is that the reporting frequency of such events increases, which increases the general perception of having more extreme events — but scientists are supposed to be able to see past such observation biases.

A corollary to this is that extremes in one part of the world do not necessarily mean that the world average is moving in that direction.  Those of us in the US would have sworn January was a cold month, but globally it turns out January was actually a pretty warm month, at least on the historic scale of the last 30 years.  I remember when agricultural futures were first popularized, farmers often went bankrupt forgetting just this corollary.  They would see weather in their area terrible, with terrible crop yields ahead, and they would go long on these crops in the futures markets, only to find the weather in other areas was quite good and they lost a fortune on their futures.

Too Bad, So Sad

Via the Arizona Republic

Arizona will no longer participate in a groundbreaking attempt to limit greenhouse-gas emissions across the West, a change in policy by Gov. Jan Brewer that will include a review of all the state’s efforts to combat climate change.

Brewer stopped short of pulling Arizona out of the multistate coalition that plans to regulate greenhouse gases starting in 2012. But she made it clear in an executive order that Arizona will not endorse the emission-control plan or any program that could raise costs for consumers and businesses.

House of Cards

Almost everywhere someone looks in the last IPCC report, they find claims that are either not substantiated by the citations or citations to non-peer-reviewed sources.    Two more examples:

Climate Quotes finds that the claims that wildfires were hurting tourism were all to non-peer-reviewed sources, and the source for the Canadian claim actually said virtually the opposite.

Bishop Hill looks at a random paragraph on climate change and food production, and finds, surprise surprise, non peer-reviewed sources and claims not backed by the citations.

Reminder on Comment Policy

I do not moderate the comments for anything other than spam.  While I have banned a couple of folks over time, I am not sure you would even need two hands to count them.  My reasons:

  • I don’ t have time.  Period.  If I had to spend the time to moderate comments here, I would have to give up blogging.  This is a hobby, and in fact real life has been unbelievably busy of late.  An example here.
  • I have little inclination to do so.  If I wanted to constantly monitor the behavior of a couple of hundred people, I would have been a 7th grade teacher
  • It is strategic (part 1).  I find that the silliest people whom folks most want to ban do much to undermine their own arguments.  Why not let them?  To paraphrase Napoleon, why interrupt someone you disagree with when they are making a mistake?  I often get asked to ban troll X who opposes everything I write, but frankly I am far more likely to want to ban commenter Y who is doing a bad job of representing or supporting my positions
  • It is strategic (part 2).  Many alarmist websites like RealClimate ruthlessly moderate out dissent from their comments.  I purposely try to position this site in contrast to that policy.  If you are an outsider, and see two sides, one of which clearly allows open debate and one which does not, which might you trust more?
  • I am learning.  Apparently unlike most everyone else on this issue, I admit that I make a lot of mistakes.  My writing and position on climate change has evolved a lot since the beginning of this blog.  I treat this blog as a voyage of discovery, and many times my commenters are providing me free education.
  • At least trolls are visiting sites they disagree with.  A lot of blog readers stay in the echo chamber.

If you really find something absolutely offensive, you can email me and I will (maybe) do something about it.  But in general, the best way to deal with trolls is to ignore them.  Really, when you see someone posting every third comment making condescending and unsupported statements with all the social graces of a 12-year-old, is your first thought, “wow, that guy is someone to be reckoned with!”?

Let me end with an example from current alarmist uber-troll Rajendra Pachauri.  If he was a commenter of mine, why would I possibly purge him?  He’s doing so much damage to his own position that even Greenpeace wants his head:

The U.N.’s climate chief dismissed “nefarious” global warming skeptics this week by insinuating that they are deep in the pockets of big business — and suggested that they go rub their faces in cancer-causing asbestos.

Rajendra Pachauri, the besieged head of the U.N.’s International Panel on Climate Change, told the Financial Times on Wednesday that he is the victim of a “carefully orchestrated” campaign to block climate change legislation.

“I would say [there are] nefarious designs behind people trying to attack me with lies, falsehoods,” he told the paper, swatting away allegations that his India-based climate institute, TERI, has benefited from decisions made by the IPCC, which he also chairs.

Climate change skeptics “are people who deny the link between smoking and cancer; they are people who say that asbestos is as good as talcum powder,” he said.

“I hope that they apply it (asbestos) to their faces every day.”

The Madness of Prince Charles

Charleses have not had the best of luck on the English throne.  And the current Prince of Wales does not seem to be doing much to change that tradition.  The other day he said:

“Well, if it is but a myth, and the global scientific community is involved in some sort of conspiracy, why is it then that around the globe sea levels are more than six inches higher than they were 100 years ago?

“This isn’t an opinion – it is a fact.”

He added: “And, ladies and gentlemen please be in no doubt that the evidence of long-term and potentially irreversible changes to our world is utterly overwhelming.”

Here is the deal with sea levels.  Yes, they were rising in 2009.  And they were rising in 2000.  And they were rising in 1950.  And they were rising in 1900.  And they were rising in 1850.   In fact, sea levels have been rising (due to thermal expansion of water and perhaps some melting land ice**) since the end of the little ice age  (and longer, see WUWT)

slide81

In fact, I would argue that this extended sea level rise helps disprove, rather than prove, the strong anthropogenic hypothesis.   The influence of manmade CO2 had to be small from 1850 to 1900 or even 1950.  Therefore, for the 1950-2000 sea level rise to be due to man, it means the natural warming had to stop at the exact same moment that anthropogenic effects took over.  Occam’s Razor says a better answer is that the end of the little ice age around 1800 has led to a general recovery of temperatures ever since.  We see the exact same pattern in glaciers melting

slide79

So many people are obsessed over whether or not current temperatures are the highest in the last 100o years or not, they forget that the temperatures in the little ice age were in fact lower than at any time in perhaps the last 5000 years.  It was very cold.

slide50

Postscript: By the way, I love the carbon footprint for me, but not for thee angle of the Prince Charles story:

Charles spoke after arriving in Manchester by Royal Train pulled by a coal-fired steam locomotive, named the Tornado, which was rebuilt from a 1948 design.

** Footnote: We know glaciers around the world have retreated since 1850, as shown above, but 90% of the world’s land ice is in Antarctica and we don’t fully understand what has happened there.  Some climatologists believe that warming weather actually increases the ice pack in Antarctica because it never will cause much melting but it increases  snowfall.

Shut Up, For the Children

Thought I would share a couple of bits of an email I got today.  The email showed a distinct lack of familiarity with the nuances of my climate position, so my guess is this may be a form letter.  I find it interesting a 17-year-old knows the term “NGO” but does not know to capitalize the first letter in a sentence (emphasis added).

hello.
this is a (hopefully) reasonable and (hopefully) well thought out message.
firstly i will say that i am 17 years old and not under the sway of any goverments/NGOs.
i believe that what you are doing with your climate skeptic blog is dangerous.
dangerous not only to yourself (in a minor way), but to my generation(in a much bigger way)….  [portion snipped out here basically talking about the writer’s view of what science is beyond dispute and lecturing me on the precautionary principle]

you’ll probably think it’s rich, being lectured on ‘responsibility’ by a mere 17 year old, but hear (or read ;)) me out…
by publishing your blog i believe you are infringing upon successive generations’ fundamental basic human right to life.
denying climate change is fine if you just hold these veiws and keep them to yourself and don’t overtly act upon them.
it does however become infinitely more dangerous to my generation to preach these views as fact(or even air them in a serious manner).
as far as i see it, this is an issue of life and death.
the way i see it, you’re going along the ‘more likely to be death’ route, and please, if only for the sake of your children, or your children’s children, stop updating your blog.

Hmm, I will pass.  But it is nice to know that folks like Al Gore, Michael Mann, and Steve Jones have passed down their fear and loathing of debate to the next generation.    I won’t share my response, but I asked him if he would prefer that my generation, instead of handing his generation a degree or so of warming, instead handed his generation an extra billion or so people in poverty.

Chinese Urbanization Study

The Guardian has an amazing series of articles about the Jones 1990 urbanization study that has been quoted by all subsequent IPCC reports as authoritative that urbanization has negligible effect on the historic temperature record. It is pretty clear that while denying the FOI requests and calling skeptics lazy and liars and irritants (etc.) they actually knew full well there were problems with the study.  This is what they were saying publicly:

n American colleague, and frequent contributor to the leaked emails, Dr Mike Mann at Pennsylvania State University, advised him: “This crowd of charlatans … look for one little thing they can say is wrong, and thus generalise that the science is entirely compromised. The last thing you want to do is help them by feeding the fire. Best thing is to ignore them completely.”

Another colleague, Kevin Trenberth at the National Centre for Atmospheric Research in Boulder, Colorado, urged a fightback. “The response should try to somehow label these guys and [sic] lazy and incompetent and unable to do the huge amount of work it takes to construct such a database.”

This is what they were saying privately:

Those concerns were most cogently expressed to Jones by his ex-boss, and former head of the CRU, Dr Tom Wigley. In August 2007, Wigley warned Jones by email: “It seems to me that Keenan has a valid point. The statements in the papers that he quotes seem to be incorrect statements, and that someone (W-C W at the very least) must have known at the time that they were incorrect.”

Wigley was concerned partly because he had been director of the CRU when the original paper was published in 1990. As he told Jones later, in 2009: “The buck should eventually stop with me.”

Wigley put to Jones the allegations made by the sceptics. “Wang had been claiming the existence of such exonerating documents for nearly a year, but he has not been able to produce them. Additionally, there was a report published in 1991 (with a second version in 1997) explicitly stating that no such documents exist.”

…Wigley, in his May 2009 email to Jones, said of Wang: “I have always thought W-C W was a rather sloppy scientist. I would …not be surprised if he screwed up here … Were you taking W-C W on trust? Why, why, why did you and W-C W not simply say this right at the start? Perhaps it’s not too late.” There is no evidence of any doubts being raised over Wang’s previous work.

Interesting.  Intriguingly, Jones did “penance” in some sense for this sloppy work by finding as much as a 1C per century urbanization bias in Chines temperature records in a later study.

Why it matters

The Guardian writes:

t is important to keep this in perspective, however. This dramatic revision of the estimated impact of urbanisation on temperatures in China does not change the global picture of temperature trends. There is plenty of evidence of global warming, not least from oceans far from urban influences.

This is correct.  Further, it is absurd to deny the world has warmed over the last 150 years as the little ice age of the 17th and 18th centuries was one of the coldest periods in thousands of years, and thus it is totally natural that we have seen warming in recovery from these frigid times.

But here is what it is important to understand:  The real debate between skeptics and alarmists is not over whether the Earth has warmed over the last century or whether CO2 from man contributes incrementally to warming.  The real debate is over whether the climate’s sensitivity to CO2 is high or low.  Skeptics like me argue for low sensitivity, on the order of 0.5-1.0C per doubling once all feedbacks are taken in to account.  Alarmists argue for numbers 3C and higher.

The problem alarmists have is that it is very, very difficult to reconcile past warming to high-sensitivity forecasts.   It takes a lot of mathematical contortions, from time-delays to cooling aerosols to ignoring ocean cycles and natural recovery from the little ice age to make the numbers reconcile.  Halving the actual historic warming by attributing the other half to measurement biases makes it even, uh, more impossible to reconcile high sensitivity models to actual history.