Evan Mills Response to My Critique of the Grid Outage Chart

A month or two ago, after Kevin Drum (a leftish supporter of strong AGW theory) posted a chart on his site that looked like BS to me.  I posted my quick reactions to the chart here, and then after talking to the data owner in Washington followed up here.

The gist of my comments were that the trend in the data didn’t make any sense, and upon checking with the data owner, it turns out much of the trend is due to changes in the data collection process.  I stick by that conclusion, though not some of the other suppositions in those posts.

I was excited to see Dr. Mills response (thanks to reader Charlie Allen for the heads up).  I will quote much of it, but to make sure I can’t be accused of cherry-picking, here is his whole post here.  I would comment there, but alas, unlike this site, Dr. Mills chooses not to allow comments.

So here we go:

Two blog entries [1-online | PDF] [2-online | PDF] [Accessed June 18, 2009] mischaracterize analysis in a new report entitled Global Climate Change Impacts in the United States. The blogger (a self-admitted “amateur”) created a straw man argument by asserting that the chart was presented as evidence of global climate change and was not verified with the primary source. The blog’s errors have been propagated to other web sites without further fact checking or due diligence. (The use of profanity in the title of the first entry is additionally unprofessional.)

Uh, oh, the dreaded “amateur.”  Mea Culpa.  I am a trained physicist and engineer.  I don’t remember many colleges handing out “climate” degrees in 1984, so I try not to overstate my knowledge.  As to using “bullsh*t” in the title, the initial post was “I am calling bullsh*t on this chart.”  Sorry, I don’t feel bad about that given the original post was a response to a post on a political blog.

The underlying database—created by the U.S. Department of Energy’s Energy Information Administration—contains approximately 930 grid-disruption events taking place between 1992 and 2008, affecting 135 million electric customers.

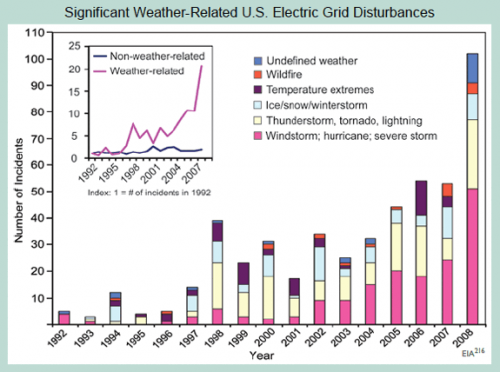
As noted in the caption to the figure on page 58 of our report (shown above)—which was masked in the blogger’s critique—

First, I am happy to admit errors where I make them (I wonder if that is why I am still an “amateur”).   It was wrong of me to post the chart without the caption. My only defense was that I copied the chart from, and was responding to its use on, Kevin Drum’s site and he too omitted the caption. I really was not trying to hide what was there.   I am on the road and don’t have the original but here it is from Dr. Mills’ post.

grid-disturbances-chart

grid-disturbances-text

Anyway, to continue…

As noted in the caption to the figure on page 58 of our report (shown above)—which was masked in the blogger’s critique—we expressly state a quite different finding than that imputed by the blogger, noting with care that we do not attribute these events to anthropogenic climate change, but do consider the grid vulnerable to extreme weather today and increasingly so as climate change progresses, i.e.:

“Although the figure does not demonstrate a cause-effect relationship between climate change and grid disruption, it does suggest that weather and climate extremes often have important effects on grid disruptions.”

The associated text in the report states the following, citing a major peer-reviewed federal study on the energy sector’s vulnerability to climate change:

“The electricity grid is also vulnerable to climate change effects, from temperature changes to severe weather events.”

To Dr. Mills’ point that I misinterpreted him — if all he wanted to say was that the electrical grid could be disturbed by weather or was vulnerable to climate change, fine.  I mean, duh.  If there are more tornadoes knocking about, more electrical lines will come down.  But if that was Dr. Mills ONLY point, then why did he write (emphasis added):

The number of incidents caused by extreme weather has increased tenfold since 1992.  The portion of all events that are caused by weather-related phenomena has more than tripled from about 20 percent in the early 1990s to about 65 percent in recent years.  The weather-related events are more severe…

He is saying flat out that the grid IS being disturbed 10x more often and more severely by weather.  It doesn’t even say “reported” incidents or “may have” — it is quite definitive.  So which one of us is trying to create a straw man?   It is these statements that I previously claimed the data did not support, and I stand by my analysis on that.

And it’s not like there is some conspiracy of skeptics to mis-interpret Mr. Mills.  Kevin Drum, a  huge cheerleader for catastrophic AGW, said about this chart:

So here’s your chart of the day: a 15-year history of electrical grid problems caused by increasingly extreme weather.

I will skip the next bit, wherein it appears that Dr. Mills is agreeing with my point that aging and increased capacity utilization on the grid could potentially increase weather-related grid outages without any actual change in the weather  (just from the grid being more sensitive or vulnerable)

OK, so next is where Mr. Mills weighs in on the key issue of the data set being a poor proxy, given the fact that most of the increase in the chart are due to better reporting rather than changes in the underlying phenomenon:

The potential for sampling bias was in fact identified early-on within the author team and—contrary to the blogger’s accusation—contact was in fact made with the person responsible for the data collection project at the US Energy Information Administration on June 10, 2008 (and with the same individual the blogger claims to have spoken to). At that time the material was discussed for an hour with the EIA official, who affirmed the relative growth was in weather-related events and that it could not be construed as an artifact of data collection changes, etc. That, and other points in this response, were re-affirmed through a follow up discussion in June 2009.

In fact, the analysis understates the scale of weather-related events in at least three ways:

  • EIA noted that there are probably a higher proportion of weather events missing from their time series than non-weather ones (due to minimum threshold impacts required for inclusion, and under-reporting in thunderstorm-prone regions of the heartland).
  • There was at least one change in EIA’s methodology that would have over-stated the growth in non-weather events, i.e., they added cyber attacks and islanding in 2001, which are both “non-weather-related”.
  • Many of the events are described in ways that could be weather-related (e.g. “transmission interruption”) but not enough information is provided. We code such events as non-weather-related.

Dr. Mills does not like me using the “BS” word, so I will just say this is the purest caca. I want a single disinterested scientist to defend what Dr. Mills is saying. Remember:

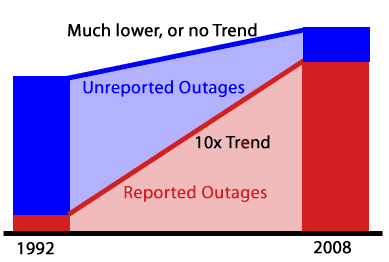
  • Prior to 1998, just about all the data is missing. There were pushes in 2001 and 2008 to try to fix under reporting.  Far from denying this, Dr. Mills reports the same facts.  So no matter how much dancing he does, much of the trend here is driven by increased reporting, not the underlying phenomenon.  Again, the underlying phenomenon may exist, but it certainly is not a 10x increase as reported in the caption.
  • The fact that a higher proportion of the missing data is weather-related just underlines the point that the historic weather-related outage data is a nearly meaningless source of trend data for weather-related outages.
  • His bullet points are written as if the totals matter, but the point of the chart was never totals.  I never said he was overstating weather related outages today.   The numbers in 2008 may still be (and probably are) understated.  And I have no idea even if 50 or 80 is high or low,  so absolute values have no meaning to me anyway.  The chart was designed to portray a trend — remember that first line of the caption “The number of incidents caused by extreme weather has increased tenfold since 1992. ” — not a point on absolute values.   What matters is therefore not how much is missing, but how much is missing in the early years as compared to the later years.
  • In my original post I wrote, as Dr. Mills does, that the EIA data owner thinks there is a weather trend in the data if you really had quality data.  Fine.  But it is way, way less of a trend than shown in this chart.  And besides, when did the standards of “peer reviewed science” stoop to include estimates of government data analysts as to what the trend in the data would be if the data weren’t corrupted so badly.   (Also, the data analyst was only familiar with the data back to 1998 — the chart started in 1992.
  • Dr. Mills was aware that the data had huge gaps before publication.  Where was the disclosure?  I didn’t see any disclosure.  I wonder if there was such disclosure in the peer reviewed study that used this data (my understanding is that there must have been one, because the rules of this report is that everything had to come from peer-reviewed sources).
  • I don’t think any reasonable person could use this data set in a serious study knowing what the authors knew.  But reasonable people can disagree, though I will say that I think there is no ethical way anyone could have talked to the EIA in detail about this data and then used the 1992-1997 data.

Onward:

Thanks to the efforts of EIA, after they took over the responsibility of running the Department of Energy (DOE) data-collection process around 1997, it became more effective. Efforts were made in subsequent years to increase the response rate and upgrade the reporting form.

Thanks, you just proved my point about the trend being driven by changes in reporting and data collection intensity.

To adjust for potential response-rate biases, we have separated weather- and non-weather-related trends into indices and found an upward trend only in the weather-related time series.

As confirmed by EIA, if there were a systematic bias one would expect it to be reflected in both data series (especially since any given reporting site would report both types of events).

As an additional precaution, we focused on trends in the number of events (rather than customers affected) to avoid fortuitous differences caused by the population density where events occur. This, however, has the effect of understating the weather impacts because of EIA definitions (see survey methodology notes below).

Well, its possible this is true, though unhappily, this analysis was not published in the original report and was not published in this post.   I presume this means he has a non-weather time series that is flat for this period.  Love to see it, but this is not how the EIA portrayed the data to me.  But it really doesn’t matter – I think the fact that there is more data missing in the early years than the later years is indisputable, and this one fact drives a false trend.

But here is what I think is really funny- — the above analysis does not matter, because he is assuming a reporting bias symmetry, but just  a few paragraphs earlier he stated that there was actually an asymmetry.  Let me quote him again:

EIA noted that there are probably a higher proportion of weather events missing from their time series than non-weather ones (due to minimum threshold impacts required for inclusion, and under-reporting in thunderstorm-prone regions of the heartland).

Look Dr. Mills, I don’t have an axe to grind here.  This is one chart out of bazillions making a minor point.  But the data set you are using is garbage, so why do you stand by it with such tenacity?  Can’t anyone just admit “you know, on thinking about it, there are way to many problems with this data set to declare a trend exists.  Hopefully the EIA has it cleaned up now and we can watch it going forward.”  But I guess only “amateurs” make that kind of statement.

The blogger also speculated that many of the “extreme temperature” events were during cold periods, stating “if this is proof of global warming, why is the damage from cold and ice increasing as fast as other severe weather causes?” The statement is erroneous.

This was pure supposition in my first reaction to the chart.  I later admitted that I was wrong.  Most of the “temperature” effects are higher temperature.  But I will admit it again here – that supposition was incorrect.  He has a nice monthly distribution of the data to prove his point.

I am ready to leave this behind, though I will admit that Dr. Mills response leaves me more rather than less worried about the quality of the science here.  But to summarize, everything is minor compared to this point:  The caption says “The number of incidents caused by extreme weather has increased tenfold since 1992.”  I don’t think anyone, knowing about the huge underreporting in early years, and better reporting in later years, thinks that statement is correct.  Dr. Mills should be willing to admit it was incorrect.

Update: In case I am not explaining the issue well, here is a conceptual drawing of what is going on:
trend

Update #2: One other thing I meant to post.  I want to thank Dr. Mills — this is the first time in quite a while I have received a critique of one of my posts without a single ad hominem attack, question about my source of funding, hypothesized links to evil forces, etc.  Also I am sorry I wrote “Mr.” rather than “Dr.” Mills.  Correction has been made.

Warm Weather and Prosperity

I get it that a 15F increase in global temperatures would not be good for agriculture.  Of course, I think 15F is absurd, at least from anthropogenic CO2.

However, for the types of warming we are seeing (in the tenths of a degree), such warming has always been a harbinger of prosperity through history.  The medieval warm period in Europe was a time of expanding populations driven by increasing harvests.  When the medieval warm period ended and decades of cooler weather ensued, the Great Famine resulted — a famine which many blame for weakening the population and making later plague outbreaks more severe.

I read a lot of history, and take a number of history courses (both on tape and live).  Its so funny when the professor gets to these events, because she/he always has to preface his remarks with “I know you have been tought that warming is universally bad, but…”

2009 may rank as a below average year for American agriculture, not because of heat, but because of late frosts and an unusually cool summer.

Do Arguments Have to Be Symmetric?

I am looking at some back and forth in this Flowing Data post.

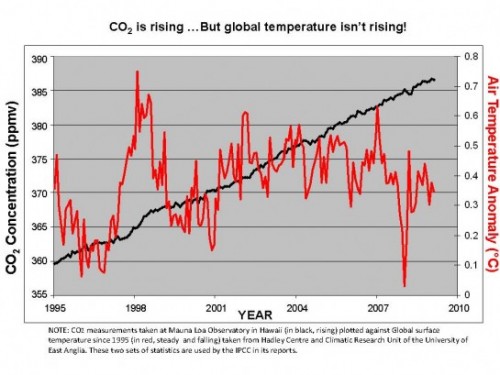
Apparently an Australian Legislator named Stephen Fielding posted this chart and asked, “Is it the case that CO2 increased by 5% since 1998 whilst global temperature cooled over the same period (see Fig. 1)?  If so, why did the temperature not increase; and how can human emissions be to blame for dangerous levels of warming?”

the_global_temperature_chart-545x409

Certainly this could sustain some interesting debate.  Climate is complex, so their might be countervailing effects to CO2, but it also should be noted that none of the models really predicted this flatness in temperatures, so it certainly could be described as “unexpected” at least among the alarmist community.

Instead, the answer that came back from Stephen Few was this (as reported by Flowing Data, I cannot find this on Few’s site):

This is a case of someone who listens only to what he wants to hear (the arguments of a few fringe organizations with agendas) and either ignores or is incapable of understanding the overwhelming weight of scientific evidence. He selected a tiny piece of data (a short period of time, with only one of many measures of temperature), misinterpreted it, and ignored the vast collection of data that contradicts his position. This fellow is either incredibly stupid or a very bad man.

Every alarmist from Al Gore to James Hansen has used this same chart in their every presentation – showing global temperatures since 1950  (or really since 1980) going up in lockstep with Co2.  This is the alarmists #1 chart.  All Fielding has done is shown data after 1998, something alarmists tend to be reluctant to do.  Sure it’s a short time period, but nothing in any alarmist prediction or IPCC report hinted that there was any possibility that for even so short a time as 15 years warming might cease  (at least not in the last IPCC report, which I have read nearly every page of).  So, by using the alarmists’ own chart and questioning a temperature trend that went unpredicted, Fielding is “either incredibly stupid or a very bad man.”  Again, the alarmist modus operandi – it is much better to smear the person in ad hominem attacks than deal with his argument.

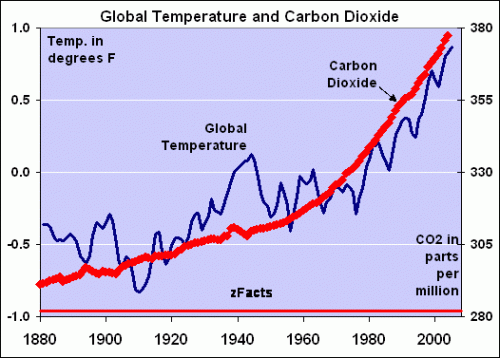
Shouldn’t there be symmetry here?  If it is OK for every alarmist on the planet to show 1980-1995 temperature growing in lockstep with CO2 as “proof” of a relationship, isn’t it equally OK to show 1995-2010 temperature not growing in lockstep with CO2 to question the relationship?  Why is one ok but the other incredibly stupid and/or mean-spirited?   I mean graphs like this were frequent five years ago, though they have dried up recently:

zfacts-co2-temp

For extra credit, figure out how they got most of the early 2000’s to be warmer than 1998 in this chart, since I can find no major temperature metric that matches this.  I suspect some endpoint smoothing games here.

I won’t get into arguing the “overwhelming weight of scientific evidence” statement, as I find arguments over counting scientific heads or papers to be  useless in the extreme.  But I will say that as a boy when I learned about the scientific method, there was a key step where one’s understanding of a natural phenomenon is converted into predicted behaviors, and then those predictions are tested against reality.  All Fielding is doing is testing the predictions, and finding them to be missing the mark.  Sure, one can argue that the testing period has not been long enough, so we will keep testing, but what Fielding is trying to do here, however imperfectly, is perfectly compatible with the scientific method.

I must say I am a bit confused about those “many other measures of temperature.”  Is Mr. Few suggesting that the chart would have different results in Fahrenheit?  OK, I am kidding of course.  What I am sure he means is that there are groups other than the Hadley Center that produce temperature records for the globe  (though in Mr. Fielding’s defense the Hadley Center is a perfectly acceptable source and the preferred source of much of the IPCC report).  To my knowledge, there are four major metrics (Hadley, GISS, UAH, RSS).  Of these four, at least three (I am not sure about the GISS) would show the same results.  I think the “overwhelming weight” of temperature metrics makes the same point as Mr. Fielding’s chart.

In the rest of his language, Few is pretty sloppy for someone who wants to criticize someone for sloppiness.  He says that Fielding “misinterpreted” the temperature data.  How?  Seems straight forward to me.  He also says that there is a “vast collection of data that contradicts his position.”  What position is that?  If his position is merely that Co2 has increased for 15 years and temperatures have not, well, there really is NOT a vast collection of data that contradicts that.  There may be a lot of people who have published reasons whythis set of facts does not invalidate AGW, but the facts are still the same.

By the way, I get exhausted by the accusation that skeptics are somehow simplistic and can’t understand complex systems.    I feel like my understanding is pretty nuanced. By the way, its interesting how the sides have somewhat reversed here.  When temperature was going up steadily, it was alarmists saying that things were simple and skeptics saying that climate was complex and you couldn’t necessarily make the 1:1 correlation between CO2 and temperature increases.  Now that temperature has flat lined for a while, it is alarmists screaming that skeptics are underestimating the complexity.  I tend to agree — climate is indeed really really complex, though I think if one accepts this complexity it is hard to square with the whole “settled science” thing.  Really, we have settled the science in less than 20 years on perhaps the most complex system we have ever tried to understand?

The same Flowing Data post references this post from Graham Dawson.  Most of Dawson’s “answers” to Fieldings questions are similar to Few’s, but I wanted to touch on one or two other things.

First, I like how he calls findings from the recent climate synthesis report the “government answer” as if this makes it somehow beyond dispute.  But I digress.

The surface air temperature is just one component in the climate system (ocean, atmosphere, cryosphere). There has been no material trend in surface air temperature during the last 10 years when taken in isolation, but 13 of the 14 warmest years on record have occurred since 1995. Also global heat content of  the ocean (which constitutes 85% of the total warming) has continued to rise strongly in this period, and ongoing warming of the climate system as a whole is supported by a very wide range of observations, as reported in the peer-reviewed scientific literature.

This is the kind of blithe answer that is full of inaccuracies everyone needs to be careful about.  The first sentence is true, and the second is probably close to the mark, though with a bit more uncertainty than he implies.  He is also correct that global heat content of the ocean is a huge part of warming or the lack thereof, but his next statement is not entirely correct.  Ocean heat content as measured by the new ARGO system since 2003 has been flat to down.  Longer term measures are up, but most of the warming comes at the point the old metrics were spliced to the ARGO data, a real red flag to any serious data analyst.  The cryospehere is important as well, but most metrics show little change in total sea ice area, with losses in the NH offset by gains in the SH.

While the Earth’s temperature has been warmer in the geological past than it is today, the magnitude and rate of change is unusual in a geological context. Also the current warming is unusual as past changes have been triggered by natural forcings whereas there are no known natural climate forcings, such as changes in solar irradiance, that can explain the current observed warming of the climate system. It can only be explained by the increase in greenhouse gases due to human activities.

No one on Earth has any idea if the first sentence is true — this is pure supposition on the author’s part, stated as a fact.  We are talking about temperature changes today over a fifty year (or shorter) period, and we have absolutely no way to look at changes in the “geological past” on this fine of a timescale.  I am reminded of the old ice core chart that was supposedly the smoking gun between CO2 and temperature, only to find later as we improved the time resolution that temperature increases came before Co2 increases.

I won’t make too much of my usual argument on the sun, except to say that the Sun has been substantially more active during the warming period of 1950-2000 than it has been in other times.  What I want to point out, though, is the core foundation of the alarmist argument, one that I have pointed out before.  It boils down to:  Past warming must be due to man because we can’t think of what else it could be.   This is amazing hubris, representing a total unwillingness to admit what we do and don’t understand.  Its almost like the ancient Greeks, attributing what they didn’t understand in the cosmos to the hijinx of various gods.

It is not the case that all GCM computer models projected a steady increase in temperature for the period 1990-2008.  Air temperatures are affected by natural variability.  Global Climate Models show this variability in the long term but are not able to predict exactly when such variations will happen. GCMs can and do simulate decade-long periods of no warming, or even slight cooling, embedded in longer-term warming trends.

But none showed zero warming, or anything even close.

So Why Bother?

I just watched Peter Sinclair’s petty little video on Anthony Watt’s effort to survey and provide some level of quality control on the nation’s surface temperature network.  Having participated in the survey, I was going to do a rebuttal video from my own experience, but I just don’t have the time, but I want to offer a couple of quick thoughts.

  • Will we ever see an alarmist be able to address any skeptics critique of AGW science without resorting to ad hominem attacks?  I guess the whole “oil industry funding” thing is a base requirement for any alarmist article, but this guy really gets extra credit for the tobacco industry comparison.  Seriously, do you guys really think this addresses the issue?
  • I am fairly sure that Mr. Watt would not deny that the world has warmed over the last 100 years, though he might argue that warming has been exaggerated somewhat.  Certainly satellites are immune to the biases and problems Mr. Watt’s group is identifying, and they still show warming  (though less than the surface temperature networks is showing).
  • The video tries to make Watt’s volunteers sound like silly children at camp, but in fact weather measurement and data collection in this country have a long history of involvement and leadership by volunteers and amateurs.
  • The core point that really goes unaddressed is that the government, despite spending billions of dollars on AGW-related projects, is investing about zero in quality control of the single most critical data set to the current public policy decisions.   Many of the sites are absolutely inexcusable, EVEN against the old goals of reporting weather rather than measuring climate change.  I surveyed the Tucson site – it is a joke.
  • Mr. Sinclair argues that the absolute value of the temperatures does not matter as much as their changes over time.  Fine, I would agree.  But again, he demonstrates his ignorance.  This is an issue Anthony and most of his readers discuss all the time.  When, for example, we talk about the really biased site at Tucson, it is always in the context of the fact that 100 years ago Tucson was a one horse town, and so all the urban heat biases we might find in a badly sited urban location have been introduced during the 20th century measurement period.  These growing biases show up in the measurements as increasing temperatures.  And the urban heat island effects are huge.  My son and I personally measured about 10F in the evening.  Even if this was only at Tmin, and was 0 effect at Tmax  (daily average temps are the average of Tmin and Tmax) then this would still introduce a bias of 5F today that was surely close to zero a hundred years ago.
  • Mr. Sinclair’s knowledge about these issues is less than one of our readers might have had 3 years ago.  He says we should be satisfied with the data quality because the government promises that it has adjusted for these biases.  But these very adjustments, and the inadequacy of the process, is one reason for Mr. Watt’s efforts.  If Mr. Sinclair had bothered to educate himself, he would know that many folks have criticized these adjustments because they are done blind, without any reference to actual station quality or details, by statistical processes.  But without the knowledge of which stations have better installations, the statistical processes tend to spread the bias around like peanut butter, rather than really correct for it, as demonstrated here for Tucson and the Grand Canyon (both of these stations I have personally visited).
  • The other issue one runs into in trying to correct for a bad site through adjustments is the signal to noise problem.  The world global warming signal over the last 100 years has been no more than 1 degree F.  If urban heat biases are introducing a 5,8, or 10 degree bias, then the noise, and thus the correction factor, is 5-10 times larger than the signal.   In practical terms, this means a 10-20% error in the correction factor can completely overwhelm the signal one is trying to detect.  And since most of the correction factors are not much better than educated guesses, their errors are certainly higher than this.
  • Overall Mr. Sinclair’s point seems to be that the quality of the stations does not matter.  I find that incredible, and best illustrated with an example.  The government makes decisions about the economy and interest rates and taxes and hundreds of other programs based on detailed economic data.  Let’s say that instead of sampling all over Arizona, they just sampled in one location, say Paradise Valley zip code 85253.  Paradise Valley happens to be (I think) the wealthiest zip code in the state.  So, if by sampling only in Paradise Valley, the government decides that everyone is fine and no one needs any government aid, would Mr. Sinclair be happy?  Would this be “good enough?”  Or would we demand an investment in a better data gathering network that was not biased towards certain demographics to make better public policy decisions involving hundreds of billions of dollars?

Another Reason I Trust Satellite Data over Surface Data

There are a number of reasons to prefer satellite data over surface data for temperature measurement –satellites have better coverage and are not subject to site location  biases.  On the flip side, satellites only have limited history (back to 1979) so it is of limited utility for long-term analyses.  Also,they do not strictly measure the surface, but the lower troposphere (though most climate models expect these to move in tandem).  And since some of the technologies are newer, we don’t fully understand biases or errors that may be in the measurement system (though satellites are not any newer than certain surface temperature measurement devices that are suspected of biases).  In particular, sattelites are subject to some orbital drift and changes in altitude and sensor function over time that must be corrected, perhaps imperfectly to date.

To this latter point, what one would want to see is an open dialog, with a closed loop between folks finding potential problems (like this one) and folks fixing or correcting the problems.  In the case of both the UAH and RSS teams, both have been very responsive to outside criticism of their methodologies, and have improved them over time.  This stands in stark contrast to the GISS and other surface temperature teams, who resist criticism intensely, put few resources into quality control (Hansen says a quarter man year at the GISS) and who refuse to credit outsiders even when changes are made under external presure.

Sucker Bet

Vegas casinos love the sucker bet.  Nothing makes the accountants happier than seeing someone playing the Wheel of Fortune, or betting on “12, the hard way” in craps, or taking insurance in blackjack.  While the house always maintains a slim advantage, these bets really stack the deck in the house’s favor.

And just as I don’t feel guilty for leaving Caesar’s Palace without playing the Wheel of Fortune, I don’t feel a bit of guilt for not taking this bet from Nate Silver:

1. For each day that the high temperature in your hometown is at least 1 degree Fahrenheit above average, as listed by Weather Underground, you owe me $25. For each day that it is at least 1 degree Fahrenheit below average, I owe you $25.

I presume Silver is a smart guy and knows what he is doing, because in fact this is not a bet on future warming, but on past warming.  Even without a bit of future warming, he wins this bet.  Why?

I am sitting in my hotel room, and so I don’t have time to dig into the Weather Underground’s data definitions, but my guess is that their average temperatures are based on historic data, probably about a hundred years worth on average.

Over the last 100 years the world has on average warmed about 1F.  This means that today, again on average, most locations will sit on a temperature plateau about 0.5F higher than the average.  So by structuring this bet like this, he is basically asking people  to take “red” in roulette while he takes black and zero and double zero.   He has a built in 0.5F advantage.  Even with zero future warming.

Now, the whole point of this bet may be to take money from skeptics who don’t bother to educate themselves on climate and believe Rush Limbaugh or whoever that there has never been any change in world temperatures.  Fine.  I have little patience with either side of the debate that want to be vocal without educating him or herself on the basic facts.  But to say this is a bet on future warming is BS.

The other effect that may exist here (but I am less certain of the science, commenters can help me out) is that by saying “your hometown” we put the bet into the domain of urban heat islands and temperature station siting issues.  Clearly UHI has substantially increased temperatures in many cities, but that is because average temperatures are generally computed as the average of the daily minimum and maximum.  My sense is that UHI has a much bigger effect on Tmin than Tmax – such that my son and I found a 10 degree F UHI in Phoenix in the evening, but I am not sure if we could find one, or as large of one, at the daily maximum.  Nevertheless, to the extent that such an effect exists for Tmax, most cities that have grown over the last few years will be above their averages just from the increasing UHI component.

I don’t have the contents of my computer hard drive here with me, but a better bet would be from a 10-year average of some accepted metric  (I’d prefer satellites but Hadley CRUT would be OK if we just had to use the old dinosaur surface record).  Since I accept about 1-1.2C per century, I’d insist on this trend line and would pay out above it and collect below it  (all real alarmists consider a 1.2C per century future trend to be about zero probability, so I suspect this would be acceptable).

Wow, Look at that Science

The Thin Green Line blog really wants to mix it up and debunk those scientific myths propounded by skeptics.  I had my hopes up for an interesting debate, until I clicked through and saw that the author spent the entire post fact-checking Sen. Inhofe’s counts of scientists who are skeptical.  Barf.  I wrote back in the comments:

I just cannot believe that your “best” argument is to get into this stupid scientist headcount scoreboard thing.  Never has any argument had less to do with science than counting heads and degrees.  Plenty of times the majority turns out to be correct, but on any number of issues lone wolfs have prevailed after decades of being reviled by the majority of scientists (plate tectonics theory comes to mind).

If you want to deal with the best arguments from the scientific rather than political wing of the skeptic community, address this next:  It is  very clear in the IPCC reports (if one reads them) that in fact catastrophic warming forecasts are based on not one but two independent theories.  The first is greenhouse gas theory, and I agree that it is a fairly thin branch to try to deny that greenhouse gas theory is wrong.  The IPCC says that greenhouse gas effects in isolation will cause about 1-1.2C of warming by 2100, and I am willing to agree to that.

However, this is far short of popular forecasts, which range from 3C and up (and up and up).   The rest of the warming comes from a second independent theory, that the world’s climate is dominated by positive feedbacks.  Over 2/3 of the IPCC’s warming forecasts, and a higher percentage of more aggressive forecasts, come from this second order feedback effect rather than directly from greenhouse gas warming.

There is a reason we never hear much of this second theory.  It’s because it is very, very weak.  So weak that honest climate scientists will admit they are not even sure of the sign (positive or negative) of key feedbacks (e.g. clouds) or which feedbacks dominate.  It is also weak because many of the modelers have chosen assumptions for positive feedbacks on the far end of believability.  Recent forecasts of 15F of warming imply a feedback percentage of positive 85%**, and when people talk of “tipping points” they are implying feedbacks greater than 100%.

There is just no evidence that feedbacks are this high, and even some evidence they are net negative.  In fact, just a basic reality check would make any physical scientist suspicious of a long-term stable system with a 70-85% positive net feedback fraction.  Really?

When global warming alarmists try to cut off debate, they claim the science is settled, but this is half disingenuous.  It is fairly strong and I am willing to accept it for the greenhouse effect and 1C per century.  But the science behind net positive climate feedback is weak, weak, weak, particularly when trying to support a 15F forecasts.

I would love to see this addressed.

(**note for readers new to feedback issues.  The initial warming from CO2 is multiplied by a feedback F.  F=1/(1-f), where f is the fraction of the initial input that is fed back in the first round of a recursive process.  Numbers above like 70%, 85%, and 100% refer to f.  For example, an f of 75% makes F=4, which would increase a warming forecast from 1C in 2100 from CO2 alone to a total of 4C.)

What A Real Global Warming Insurance Policy Would Look Like

It is frustrating to see the absolutely awful Waxman-Markey bill creeping through Congress.  Not only will it do almost nothing measurable to world temperatures, but it would impose large costs on the economy and is full of pork and giveaways to favored businesses and constituencies.

It didn’t have to be that way.   I think readers know my position on global warming science, but the elevator version is this:  Increasing atmospheric concentrations of CO2 will almost certainly warm the Earth — absent feedback effects, most scientists agree it will warm the Earth about a degree C by the year 2100.  What creates the catastrophe, with warming of 5 degrees or more, are hypothesized positive feedbacks in the climate.  This second theory of strongly net positive feedback in climate is poorly proven, and in fact evidence exists the sign may not even be positive.  As a result, I believe warming from man’s Co2 will be small and manageable, and may even been unnoticeable in the background noise of natural variations.

I get asked all the time – “what if you are wrong?  What if the climate is, unlike nearly every other long-term stable natural process, dominated by strong positive feedbacks?  You buy insurance on your car, won’t you buy insurance on the earth?”

Why, yes, I answer, I do buy insurance on my car.  But I don’t pay $20,000 a year for a policy with a $10,000 deductible on a car worth $11,000.  That is Waxman-Markey.

In fact, there is a plan, proposed by many folks including myself and even at least one Congressman, that would act as a low-cost insurance policy.  It took 1000+ pages to explain the carbon trading system in Waxman-Markey– I can explain this plan in two sentences:  Institute a federal carbon excise tax on fuels whose rate increases with the carbon content per btu of the fuel.  All projected revenues of this carbon tax shall be offset with an equivalent reduction in payroll (social security) taxes. No exemptions, offsets, exceptions, special rates, etc.  Everyone gets the same fuel tax rate, everyone gets the same payroll tax rate cut.

Here are some of the advantages:

  • Dead-easy to administer.  The government overhead to manage an excise tax would probably be shockingly large to any sane business person, but it is at least two orders of magnitude less than trying to administer a cap and trade system.  Just compare the BOE to CARB in California.
  • Low cost to the economy.  This plan may hurt the economy or may even boost it, but either effect is negligible compared to the cost of Waxman-Markey.  Politically it would fly well, as most folks would accept a trade of increasing the cost of fuel while reducing the cost of employment.
  • Replaces one regressive (or at least not progressive) tax with a different one.  In net should not increase or decrease how progressive or regressive the tax code is.
  • Does not add any onerous carbon tracking or reporting to businesses

Here are why politicians will never pass this plan:

  • They like taxes that they don’t have to call taxes.  Take Waxman-Markey — supporters still insist it is not a tax.  This is grossly disingenuous.  Either it raises the cost of electricity and fuel or it does not.  If it does not, it has absolutely no benefits on Co2 production.  If it does, then it is a tax.
  • The whole point is to be able to throw favors at powerful campaign supporters.  A carbon tax leaves little room for this.  A cap and trade bill is a Disneyland for lobbyists.

Here are three problems, which are minor compared to those of Waxman-Market:

  • We don’t know what the right tax rate is.  But almost any rate would have more benefit, dollar for dollar, than Waxman-Market.  And if we get it wrong, it can always be changed.  And it we get it too high, the impacts are minimized because that results in a higher tax cut in employment taxes.
  • Imports won’t be subject to the tax.  I would support just ignoring this problem, at least at first.  We don’t worry about changing import duties based on any of our other taxes, and again this will affect the mix but likely not the overall volumes by much
  • Making the government dependent on a declining revenue source.  This is probably the biggest problem — if the tax is successful, then the revenue source for the government dries up.  This is the problem with sin taxes in general, and why we find the odd situation of states sometimes doing things that promote cigarette sales because they can’t afford declining cigarette taxes, the decline in which was caused by the state’s efforts to tax and reduce cigarette use.

Postscript: The Meyer Energy Plan Proposal of 2007 actually had 3 planks:

  1. large federal carbon tax, offset by reduction in income and/or payroll taxes
  2. streamlined program for licensing new nuclear reactors
  3. get out of the way

A Window Into the IPCC Process

I thought this article by Steve McIntyre was an interesting window on the IPCC process.  Frequent readers of this site know that I believe that feedbacks in the climate are the key issue of anthropogenic global warming, and their magnitude and sign separate mild, nearly unnoticeable warming from catastrophe.  McIntyre points out that the IPCC fourth assessment spent all of 1 paragraph in hundreds of pages on the really critical issue:

As we’ve discussed before (and is well known), clouds are the greatest source of uncertainty in climate sensitivity. Low-level (“boundary layer”) tropical clouds have been shown to be the largest source of inter-model difference among GCMs. Clouds have been known to be problematic for GCMs since at least the Charney Report in 1979. Given the importance of the topic for GCMs, one would have thought that AR4 would have devoted at least a chapter to the single of issue of clouds, with perhaps one-third of that chapter devoted to the apparently thorny issue of boundary layer tropical clouds.

This is what an engineering study would do – identify the most critical areas of uncertainty and closely examine all the issues related to the critical uncertainty. Unfortunately, that’s not how IPCC does things. Instead, clouds are treated in one subsection of chapter 8 and boundary layer clouds in one paragraph.

It turns out that this one paragraph was lifted almost intact from the work of the lead author of this section of the report.  The “almost” is interesting, though, because every single change made was to eliminate or tone down any conclusion that cloud feedback might actually offset greenhouse warming.  He has a nearly line by line comparison, which is really fascinating.  One sample:

Bony et al 2006 had stated that the “empirical” Klein and Hartmann (1993) correlation “leads” to a substantial increase in low cloud cover, which resulted in a “strong negative” cloud feedback. Again IPCC watered this down: “leads to” became a “suggestion” that it “might be” associated with a “negative cloud feedback” – the term “strong” being dropped by IPCC.

Remember this is in the context of a report that generally stripped out any words that implied doubt or lack of certainty on the warming side.

Airports Are Getting Warmer

It is always struck me as an amazing irony that the folks at NASA (the GISS is part of NASA) is at the vanguard of defending surface temperature measurement  (as embodied in the GISS metric) against measurement by NASA satellites in space.

For decades now, the GISS surface temperature metric has diverged from satellite measurement, showing much more warming than have the satellites.   Many have argued that this divergence is in large part due to poor siting of measurement sites, making them subject to urban heat island biases.  I also pointed out a while back that much of the divergence occurs in areas like Africa and Antarctica where surface measurement coverage is quite poor compared to satellite coverage.

Anthony Watt had an interesting post where he pointed out that

This means that all of the US temperatures – including those for Alaska and Hawaii – were collected from either an airport (the bulk of the data) or an urban location

I will remind you that my son’s urban heat island project (which got similar results as the “professionals”) showed a 10F heat island over Phoenix, centered approximately on the Phoenix airport.  And don’t forget the ability of scientists to create warming through measurement adjustments in the computer, a practice on which Anthony has an update (and here).

Worrying About the Amazon

Kevin Drum posted on what he called a “frightening” study about global warming positive feedback effects from drought in the Amazon.   Paul Brown writes about a study published by Oliver Phillips in Science recently:

Phillips’s findings, which were published earlier this year in the journal Science, are sobering. The world’s forests are an enormous carbon sink, meaning they absorb massive quantities of carbon dioxide, through the processes of photosynthesis and respiration. In normal years the Amazon alone absorbs three billion tons of carbon, more than twice the quantity human beings produce by burning fossil fuels. But during the 2005 drought, this process was reversed, and the Amazon gave off two billion tons of carbon instead, creating an additional five billion tons of heat-trapping gases in the atmosphere. That’s more than the total annual emissions of Europe and Japan combined….

Phillips’s findings, which were published earlier this year in the journal Science, are sobering. The world’s forests are an enormous carbon sink, meaning they absorb massive quantities of carbon dioxide, through the processes of photosynthesis and respiration. In normal years the Amazon alone absorbs three billion tons of carbon, more than twice the quantity human beings produce by burning fossil fuels. But during the 2005 drought, this process was reversed, and the Amazon gave off two billion tons of carbon instead, creating an additional five billion tons of heat-trapping gases in the atmosphere. That’s more than the total annual emissions of Europe and Japan combined.

As if that’s not enough bad news, new research presented in March at a conference organized by the University of Copenhagen, with the support of the Intergovernmental Panel on Climate Change, says that as much as 85 percent of the Amazon forests will be lost if the temperature in the region increases by just 7.2 degrees Fahrenheit.

There are several questions I had immediately, which I won’t dwell on too much in this article because I have yet to get a copy of the actual study.  However, some immediate thoughts:

  • Studies like this are interesting, but a larger question for climate science is at what point does continuing to study only positive feedback effects in climate without putting similar effort into understanding and scaling negative feedback effects become useless?  After all, it is the net of positive and negative feedback effects that matter.  Deep understanding of one isolated effect in a wildly complex and chaotic system only has limited utility.
  • I am willing to believe that a 2005 drought led to a 2005 reduction or even reversal of the Amazon’s ability to consume carbon.  But what has happened since?  It seems to me quite possible that when the rains returned, there was a year of faster than average growth, and that much of the carbon emitted in 2005 may well have been re-absorbed in the subsequent years.
  • I am always suspicious of studies focusing on one area that simultaneously draw conclusions about links to certain climate effects.  For example, did the biologists measuring forest growth really put an equal quality effort into showing that the drought was not caused by el Nino or other ENSO variations and was instead caused by global warming?  I doubt it.  I have not seen the study in question, but in every one I have seen like this the connection of the effect measured to anthropogenic global warming is gratuitous and unproven, but accepted in a peer-reviewed journal nonetheless because the core findings (in this case on forest growth) were well studied and the global warming conclusion fit the pre-conceived notions of the reviewers.

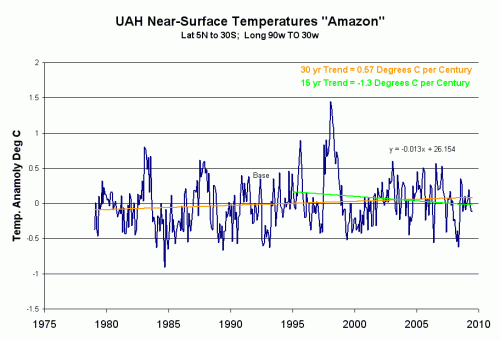
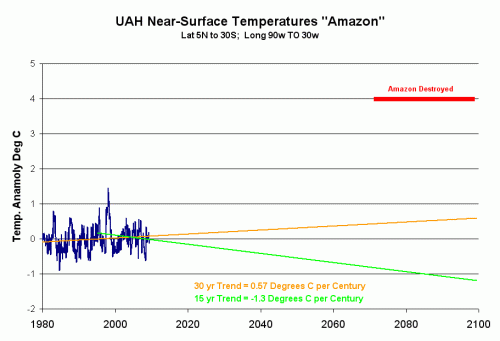
But should we worry?  Will the Amazon warm 7.2F (4C) and be wiped out?  Well, I thought I would look.  I was prompted to run the numbers because I know that most global temperature metrics show little or no warming over the last 30 years in the tropics, but I had never seen numbers just for the Amazon area.

To get these numbers, I went to the KNMI climate explorer and pulled the UAH satellite near-surface data for the Amazon and nearby oceans.  I know some folks have problems with satellite because they are only near-surface, but 30 years of history has shown that this data comes very close to following surface temperature changes, and all the surface measurement databases for this area are so riddled with holes and data gaps that they are virtually useless (trying to use the surface temperature record outside of the US and Europe and some small parts of Asia and Australia is very dangerous).

I used latitude 5N to 30S and Longitude 90W to 30W as shown on the box below:

amazon-temp-map

Pulling the data and graphing it, this is what we see (click to enlarge):

amazon-graph-1a

Over the last 30 years, the area has seen a temperature trend of about a half degree C (less than one degree F) per century.  I included the more recent trend in green because the first thing I always hear back is “well, the trend may have been low in the past, but it is accelerating!” In fact, most of this warming trend was in the first half of the period — since 1995 the trend has been negative more than a degree per century.

So how much are we in danger of hitting anywhere close to 7.2F?

amazon-graph-2

I am personally worried about man destroying the Amazon, but not by CO2.  My charity of choice is private land trusts that purchase land in the Amazon for preservation.  I still think that is a better approach to saving the Amazon than worrying about US tailpipe emissions.

Bad Legislation

I would like to say that Waxman-Markey (the recently passed house bill to make sure everyone has new clothes just like the Emperor’s) is one of the worst pieces of legislation ever, resulting from one of the worst legislative processes in memory.  But I am not sure I can, with recent bills like TARP and the stimulus act to compete with.  Nevertheless, it will be bad law if passed, a giant back door step towards creating a European-style corporate state.  The folks over at NRO have read some of the bill (though probably not all) and have 50 low-lights.  Read it all, it is impossible to excerpt — just one bad provision after another.

I found this bit from Bruce McQuain similar in spirit to the rest of the bill, but hugely ironic:

Consider the mundane topic of shade trees:

SEC. 205. TREE PLANTING PROGRAMS.

(a) Findings- The Congress finds that–

(1) the utility sector is the largest single source of greenhouse gas emissions in the United States today, producing approximately one-third of the country’s emissions;

(2) heating and cooling homes accounts for nearly 60 percent of residential electricity usage in the United States;

(3) shade trees planted in strategic locations can reduce residential cooling costs by as much as 30 percent;

(4) shade trees have significant clean-air benefits associated with them;

(5) every 100 healthy large trees removes about 300 pounds of air pollution (including particulate matter and ozone) and about 15 tons of carbon dioxide from the air each year;

(6) tree cover on private property and on newly-developed land has declined since the 1970s, even while emissions from transportation and industry have been rising; and

(7) in over a dozen test cities across the United States, increasing urban tree cover has generated between two and five dollars in savings for every dollar invested in such tree planting.

So now the federal government will issue guidelines and hire experts to ensure you plant shade trees properly:

(4) The term ‘tree-siting guidelines’ means a comprehensive list of science-based measurements outlining the species and minimum distance required between trees planted pursuant to this section, in addition to the minimum required distance to be maintained between such trees and–

(A) building foundations;

(B) air conditioning units;

(C) driveways and walkways;

(D) property fences;

(E) preexisting utility infrastructure;

(F) septic systems;

(G) swimming pools; and

(H) other infrastructure as deemed appropriate

Why is this ironic?  Well, this is the same Federal government that cannot spare a dime (or more than 0.25 FTE) for bringing up its temperature measurement sites (whose output help drive this whole bill) to its own standards, allowing errors and biases in the measurements 2-3 times larger than the historic warming signal we are trying to measure.  See more here.