
I want to briefly revisit Hansen’s 1998 Congressional forecast. Yes, I and many others have churned over this ground many times, but I think I now have a better approach. The typical approach has been to overlay some actual temperature data set on top of Hansen’s forecast (e.g. here). The problem is that with revisions to all of these data sets, particularly the GISS reset in 1999, none of these data sets match what Hansen was using at the time. So we often get into arguments on where the forecast and actuals should be centered, etc.
This might be a better approach. First, let’s start with Hansen’s forecast chart (click to enlarge).
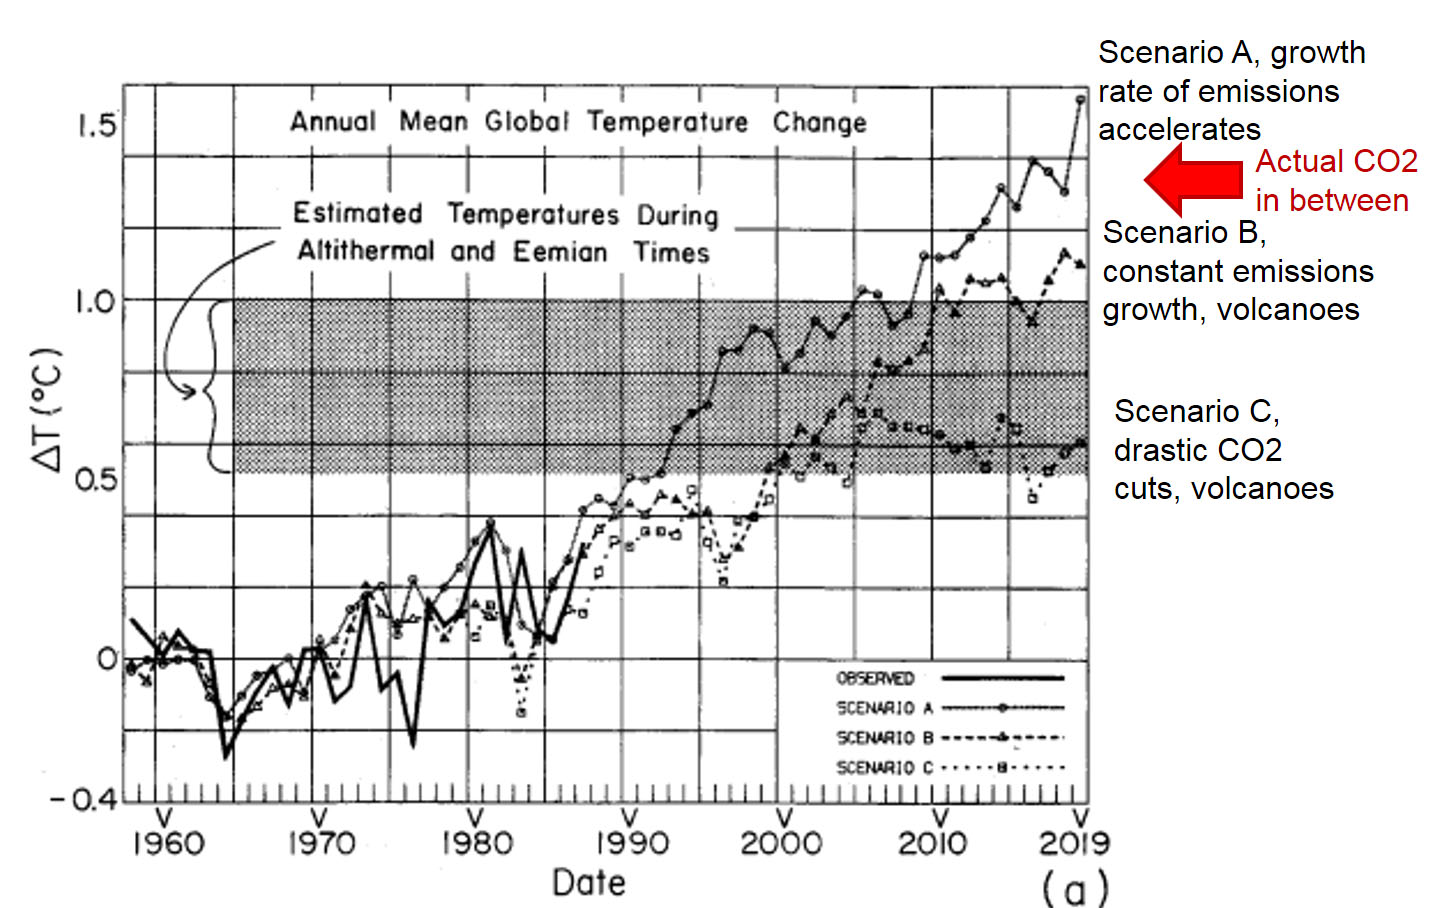
Folks have argued for years over which CO2 scenario best matches history. I would argue it is somewhere between A and B, but you will see in a moment that it almost does not matter. It turns out that both A and B have nearly the same regressed slope.
The approach I took this time was not to worry about matching exact starting points or reconciling difference anomaly base periods. I merely took the slope of the A and B forecasts and compared it to the slope over the last 30 years of a couple of different temeprature databases (Hadley CRUT4 and the UAH v6 satellite data).
The only real issue is the start year. The analysis is not very sensitive to the year, but I tried to find a logical start. Hansen’s chart is frustrating because his forecasts never converge exactly, even 20 years in the past. However, they are nearly identical in 1986, a logical base year if Hansen was giving the speech in 1988, so I started there. I didn’t do anything fancy on the trend lines, just let Excel calculate the least squares regression. This is what we get (as usual, click to enlarge).
I think that tells the tale pretty clearly. Versus the gold standard surface temperature measurement (vs. Hansen’s thumb-on-the-scale GISS) his forecast was 2x too high. Versus the satellite measurements it was 3x too high.
The least squares regression approach probably under-estimates that A scenario growth rate, but that is OK, that just makes the conclusion more robust.
By the way, I owe someone a thanks for the digitized numbers behind Hansen’s chart but it has been so many years since I downloaded them I honestly forgot who they came from.