Reconciling Conflicting Climate Claims

Cross-posted from Coyoteblog

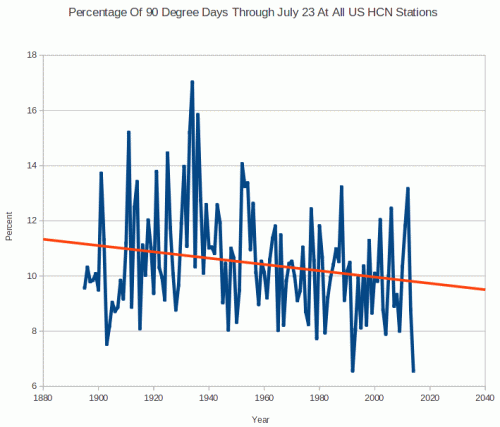
At Real Science, Steven Goddard claims this is the coolest summer on record in the US.

The NOAA reports that both May and June were the hottest on record.

It used to be the the media would reconcile such claims and one might learn something interesting from that reconciliation, but now all we have are mostly-crappy fact checks with Pinocchio counts.  Both these claims have truth on their side, though the NOAA report is more comprehensively correct.  Still, we can learn something by putting these analyses in context and by reconciling them.

The NOAA temperature data for the globe does indeed show May and June as the hottest on record.  However, one should note a couple of things

  • The two monthly records do not change the trend over the last 10-15 years, which has basically been flat.  We are hitting records because we are sitting on a plateau that is higher than the rest of the last century (at least in the NOAA data).  It only takes small positive excursions to reach all-time highs
  • There are a number of different temperature data bases that measure the temperature in different ways (e.g. satellite vs. ground stations) and then adjust those raw readings using different methodologies.  While the NOAA data base is showing all time highs, other data bases, such as satellite-based ones, are not.
  • The NOAA database has been criticized for manual adjustments to temperatures in the past which increase the warming trend.  Without these adjustments, temperatures during certain parts of the 1930’s (think: Dust Bowl) would be higher than today.  This was discussed here in more depth.  As is usual when looking at such things, some of these adjustments are absolutely appropriate and some can be questioned.  However, blaming the whole of the warming signal on such adjustments is just wrong — satellite data bases which have no similar adjustment issues have shown warming, at least between 1979 and 1999.

The Time article linked above illustrated the story of these record months with a video partially on wildfires.  This is a great example of how temperatures are indeed rising but media stories about knock-on effects, such as hurricanes and fires, can be full of it.  2014 has actually been a low fire year so far in the US.

So the world is undeniably on the warm side of average (I won’t way warmer than normal because what is “normal”?)  So how does Goddard get this as the coolest summer on record for the US?

Well, the first answer, and it is an important one to remember, is that US temperatures do not have to follow global temperatures, at least not tightly.  While the world warmed 0.5-0.7 degrees C from 1979-1999, the US temperatures moved much less.  Other times, the US has warmed or cooled more than the world has.  The US is well under 5% of the world’s surface area.  It is certainly possible to have isolated effects in such an area.  Remember the same holds true the other way — heat waves in one part of the world don’t necessarily mean the world is warming.

But we can also learn something that is seldom discussed in the media by looking at Goddard’s chart:

click to enlarge

First, I will say that I am skeptical of any chart that uses “all USHCN” stations because the number of stations and their locations change so much.  At some level this is an apples to oranges comparison — I would be much more comfortable to see a chart that looks at only USHCN stations with, say, at least 80 years of continuous data.  In other words, this chart may be an artifact of the mess that is the USHCN database.

However, it is possible that this is correct even with a better data set and against a backdrop of warming temperatures.  Why?  Because this is a metric of high temperatures.  It looks at the number of times a data station reads a high temperature over 90F.  At some level this is a clever chart, because it takes advantage of a misconception most people, including most people in the media have — that global warming plays out in higher daytime high temperatures.

But in fact this does not appear to be the case.  Most of the warming we have seen over the last 50 years has manifested itself as higher nighttime lows and higher winter temperatures.  Both of these raise the average, but neither will change Goddard’s metric of days above 90F.  So it is perfectly possible Goddard’s chart is right even if the US is seeing a warming trend over the same period.  Which is why we have not seen any more local all-time daily high temperature records set recently than in past decades.  But we have seen a lot of new records for high low temperature, if that term makes sense.  Also, this explains why the ratio of daily high records to daily low records has risen — not necessarily because there are a lot of new high records, but because we are setting fewer low records.  We can argue about daytime temperatures but nighttime temperatures are certainly warmer.

This chart shows an example with low and high temperatures over time at Amherst, MA  (chosen at random because I was speaking there).  Note that recently, most warming has been at night, rather than in daily highs.

Computer Models as “Evidence”

Cross-posted from Coyoteblog

The BBC has decided not to every talk to climate skeptics again, in part based on the “evidence” of computer modelling

Climate change skeptics are being banned from BBC News, according to a new report, for fear of misinforming people and to create more of a “balance” when discussing man-made climate change.

The latest casualty is Nigel Lawson, former London chancellor and climate change skeptic, who has just recently been barred from appearing on BBC. Lord Lawson, who has written about climate change, said the corporation is silencing the debate on global warming since he discussed the topic on its Radio 4 Today program in February.

This skeptic accuses “Stalinist” BBC of succumbing to pressure from those with renewable energy interests, like the Green Party, in an editorial for the Daily Mail.

He appeared on February 13 debating with scientist Sir Brian Hoskins, chairman of the Grantham Institute for Climate Change at Imperial College, London, to discuss recent flooding that supposedly was linked to man-made climate change.

Despite the fact that the two intellectuals had a “thoroughly civilized discussion,” BBC was “overwhelmed by a well-organized deluge of complaints” following the program. Naysayers harped on the fact that Lawson was not a scientist and said he had no business voicing his opinion on the subject.

Among the objections, including one from Green Party politician Chit Chong, were that Lawson’s views were not supported by evidence from computer modeling.

I see this all the time.  A lot of things astound me in the climate debate, but perhaps the most astounding has been to be accused of being “anti-science” by people who have such a poor grasp of the scientific process.

Computer models and their output are not evidence of anything.  Computer models are extremely useful when we have hypotheses about complex, multi-variable systems.  It may not be immediately obvious how to test these hypotheses, so computer models can take these hypothesized formulas and generate predicted values of measurable variables that can then be used to compare to actual physical observations.

This is no different (except in speed and scale) from a person in the 18th century sitting down with Newton’s gravitational equations and grinding out five years of predicted positions for Venus (in fact, the original meaning of the word “computer” was a human being who ground out numbers in just his way).  That person and his calculations are the exact equivalent of today’s computer models.  We wouldn’t say that those lists of predictions for Venus were “evidence” that Newton was correct.  We would use these predictions and compare them to actual measurements of Venus’s position over the next five years.  If they matched, we would consider that match to be the real evidence that Newton may be correct.

So it is not the existence of the models or their output that are evidence that catastrophic man-made global warming theory is correct.  It would be evidence that the output of these predictive models actually match what plays out in reality.  Which is why skeptics think the fact that the divergence between climate model temperature forecasts and actual temperatures is important, but we will leave that topic for other days.

The other problem with models

The other problem with computer models, besides the fact that they are not and cannot constitute evidence in and of themselves, is that their results are often sensitive to small changes in tuning or setting of variables, and that these decisions about tuning are often totally opaque to outsiders.

I did computer modelling for years, though of markets and economics rather than climate.  But the techniques are substantially the same.  And the pitfalls.

Confession time.  In my very early days as a consultant, I did something I am not proud of.  I was responsible for a complex market model based on a lot of market research and customer service data.  Less than a day before the big presentation, and with all the charts and conclusions made, I found a mistake that skewed the results.  In later years I would have the moral courage and confidence to cry foul and halt the process, but at the time I ended up tweaking a few key variables to make the model continue to spit out results consistent with our conclusion.  It is embarrassing enough I have trouble writing this for public consumption 25 years later.

But it was so easy.  A few tweaks to assumptions and I could get the answer I wanted.  And no one would ever know.  Someone could stare at the model for an hour and not recognize the tuning.

Robert Caprara has similar thoughts in the WSJ (probably behind a paywall)  Hat tip to a reader

The computer model was huge—it analyzed every river, sewer treatment plant and drinking-water intake (the places in rivers where municipalities draw their water) in the country. I’ll spare you the details, but the model showed huge gains from the program as water quality improved dramatically. By the late 1980s, however, any gains from upgrading sewer treatments would be offset by the additional pollution load coming from people who moved from on-site septic tanks to public sewers, which dump the waste into rivers. Basically the model said we had hit the point of diminishing returns.

When I presented the results to the EPA official in charge, he said that I should go back and “sharpen my pencil.” I did. I reviewed assumptions, tweaked coefficients and recalibrated data. But when I reran everything the numbers didn’t change much. At our next meeting he told me to run the numbers again.

After three iterations I finally blurted out, “What number are you looking for?” He didn’t miss a beat: He told me that he needed to show $2 billion of benefits to get the program renewed. I finally turned enough knobs to get the answer he wanted, and everyone was happy…

I realized that my work for the EPA wasn’t that of a scientist, at least in the popular imagination of what a scientist does. It was more like that of a lawyer. My job, as a modeler, was to build the best case for my client’s position. The opposition will build its best case for the counter argument and ultimately the truth should prevail.

If opponents don’t like what I did with the coefficients, then they should challenge them. And during my decade as an environmental consultant, I was often hired to do just that to someone else’s model. But there is no denying that anyone who makes a living building computer models likely does so for the cause of advocacy, not the search for truth.