Climate Video Release!

My first climate movie, What is Normal?  A Critique of Catastrophic Man-Made Global Warming Theory is now available for free download.  If you have the bandwidth, I encourage you to download the full 640×480 version as Windows Media Video, but be forewarned that the file is 258MB.  This is actually a pretty small file for a 50+ minute movie, and the full resolution version looks much nicer than the streaming version.

Right-Click Here to Download Climate Movie in Full Resolution

Update:  Right-Click here for full resolution 144MB .mov quicktime version of Climate Movie

Make sure you turn up your volume — I think I recorded this with a pretty low audio level.

If you are bandwidth-challenged, or you can’t view a .WMV file, you may stream the video from Google video or download a reduced resolution version here.  Unfortunately, to make the video stream effectively, the resolution is cut to 320×240, but having watched it, it actually still looks surprisingly good streamed. 

Note, on the streaming version, the video stutters between the 12 and 17 second marks in the movie, but runs fine after that.  By the way, thanks to all the commenters who gave me some good alternatives to using my own fairly week narration voice.  I decided for this first release I wanted to see what I could achieve with a pure solo effort.  Many thanks to Adobe Premier Elements, which made this effort possible.

Finally, you can stream the reduced resolution Google video version below:

New Global Warming Video Release

Please check back Monday morning, as I will be releasing my new video, "What is Normal:  A Critique of Catastrophic Man-Made Global Warming Theory."  As with my global warming book, which began as a ten page summary and ended up as an 85-page manuscript, the video started at a goal of 15 minutes and eventually ended up at 50 minutes.  However, unlike other global warming-related videos I will not name, it is all climate science, with no self-congratulatory segments on my childhood.

CO2 and Drought

One of the sloppier predictions about global warming is that is will cause massive droughts, and certainly we have seen this line of reasoning over the last week as the media attempts to hang the blame for Southern California fire damage on CO2, when in fact most of the blame lies on rapid home construction in areas known to have a high fire danger.

I suppose the layman’s logic is as follows:  Well, it is usually hot when we have droughts, and it is hot in deserts, so therefore if the world gets hotter, we will have droughts and deserts.  Of course, this logic is silly, but is none-the-less prevenlent (does no one remember that rain forests are hot too?)

In fact, one almost certain effect of global warming will be an increase in the evaporation rate of the oceans.  Megatons more water is put into the sky as temperatures of the air and oceans rise.  Presumably, much of this water will fall as rain somewhere, so it would probably be more logical to guess that warming would cause more rain rather than less.

As Steven Malloy points out, as temperatures have risen about 0.6C over the last century, rainfall in the US and Southern California have actually increased:

During the period 1900-2005, precipitation seems to have actually increased in areas above 30 degrees north latitude — including California and the rest of the U.S. — according to the most recent assessment from the United Nations’ Intergovernmental Panel on Climate Change.

This does not mean, of course, that droughts haven’t occurred in North America over the last 100 years, but it doesn’t support a link between rising global temperature and increased drought.

Examining the occurrence of drought in southern California since 1900 is also illuminating.

According to data maintained by the federal National Climatic Data Center, drought conditions are no stranger to southern California.

During the period 1900 to 2005, moderate-to-severe drought conditions occurred in Southern California during 34 of those 106 years — that is, about one-third of the time.

Comparing the southern California drought record against the global temperature record reveals the following:

— During the period 1900-1940, when most of the 20th century’s one-degree Fahrenheit temperature increase occurred, there were 7 years of moderate-to-severe drought.

— During the period 1941-1975, when global temperatures cooled, giving rise to concerns of a looming ice age, there were 11 years of moderate-to-severe drought.

— During the period 1976 to 1990, when global temperatures rose back to the 1940 level, there were 8 years of moderate-to-severe drought.

— Since 1991, when global temperatures rose slightly past the 1940 levels, there have been 7 years of drought.

In fact, just last week I posted drought maps that showed that while Southern California has had drought conditions over the last year…
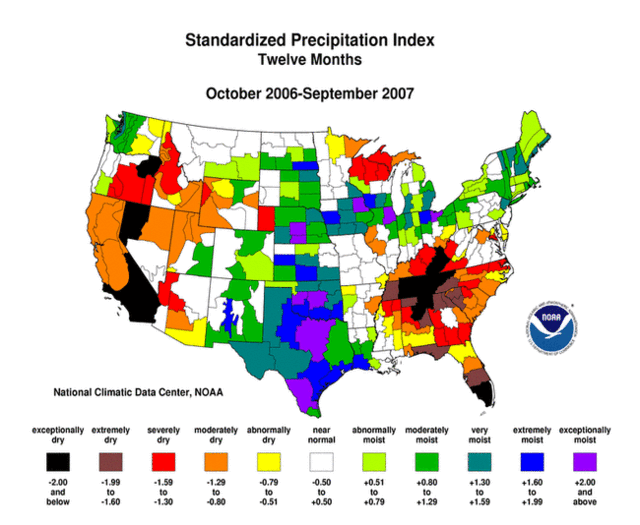
Spi12_200709_pg

…they have had absolutely average rainfall over the last five years and Northa America has been downright soggy:
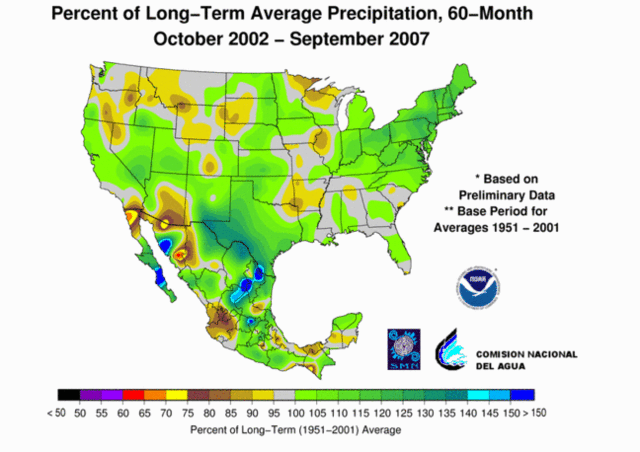
Usnmx20070960monpctpcppg

On Monday, I will be releasing my climate video tentatively titled "What is Normal?"  A recurring theme in that video is our current inability to accept extremes in the weather as "normal,"  which in fact they are.

Climate Exaggeration

There is nothing unique about the following, but I include it as an example of the unbelieveable exaggerations that are being bandied about concerning climate.  I was doing some research on the Salton Sea for a post at Coyote Blog and ran accross this letter from the California Audobon Society.  It says, in part:

Although there is uncertainty about what the precise impacts will be, there is no longer legitimate scientific disagreement about the fact that the climate is changing and that those changes will accelerate over the next century.

One of the classic rhetorical tricks is to say "it cannot be denied that" followed by two statements.  The first statement will in fact be undeniable, setting up the reader to blindly accept the second, which is much more contentious.  In this case, there is indeed no doubt that Climate is changing.  Climate is always changing, else we would still have glaciers in Minnesota.  However, it is far, far from given that the changes will "accelerate" in the next century.  In fact, the relationship between CO2 and warming is in fact a diminishing return, making "acceleration" difficult in all but a looney universe dominated by positive feedbacks.

But the real whopper comes in the next paragraph:

According to recent analyses, California is projected to experience temperature increases of at least 4-8 degrees Fahrenheit (if global emissions are significantly curtailed) and more likely temperature increases of 9-18 degrees Fahrenheit (current emissions path) over the next centur

Really?  First absolutely impossible to reconcile 9-18 degree F with the approximately 1F (0.6C) warming we have seen in the last century.  CO2 rose 100ppm in the last century and produced 1F, but adding another 200ppm in the next century will produce 9-18F??  This implies an upward sloping curve that is exactly opposite of the relationship everyone agrees CO2 and warming have.  18F implies almost two degrees a decade, a huge number considering the warming over the last decade has been close to zero and no decade has had warming of more than about 0.3F.  Further, I am sure the Sierra Club found someone who actually produced such a study, but the IPCC "consensus", which I think is exaggerated, calls for only about 4-6F increases in the next century.  Five degrees F is probably bad enough, do they really have to outright exaggerate?

Next Solar Cycle Looks Very Weak

Via Anthony Watts:

“All Quiet Alert” – That sounds like an oxymoron, and maybe it is, but the sun is extremely quiet right now, so much in fact that the Solar Influences Data Center in Belgium has issued an “All quiet alert” on October 5th. Since then, the sunspot number has remained at zero.

The sun is blank–no sunspots.

There is talk about of an extended solar minimum occurring, or perhaps a recurrence of a Dalton or Maunder type minimum. There are signs that the sun’s activity is slowing. The solar wind has been decreasing in speed, and this is yet another indicator of a slowing in the suns magnetic dynamo. Below are near real-time (updated hourly)dials of Solar Wind speed, Solar Wind Density, and Interplanetary Magnetic Field. …

One thing is certain, based on past climate history and solar history, if in fact the suns magnetic activity slows, or collapses and we enter a prolonged period of little or no sunspot activity, we’ll see a global cooling trend.

It is still too early to tell, but pretty interesting none-the-less.

Global Warming Video

Anthony Watt has a pointer to a nice presentation in four parts on YouTube by Bob Carter made at a public forum in Australia.  He walks through some of the skeptics’ issues with catastrophic man-made global warming theory.

What caught my attention, though, were the pictures Mr. Carter shows in his presentation about about 1:30 into part 4.  Because I took the pictures he shows, down at the University of Arizona, as part of Mr. Watts project to document temperature measurement stations.  Kind of cool to see someone I don’t know in a country I have (sadly) never visited using a small bit of my work.  Part 4 is below, but you can find links to all four parts here.

Coming soon, my own home-brewed video effort on global warming and climate.  Right now it runs about 45 minutes, and I’m in the editing stages, mainly trying to make the narration match what is on the screen.

Cross-posted from Coyote Blog

Warmer but Richer

James Pethoukokis via Cafe Hayek

In one of its occasional assessments, the Intergovernmental Panel on Climate Change—the cowinner with Al Gore of the Nobel Peace Prize—posited a scenario in which the global economy would grow at about 2 percent a year for the next 100 years (it’s growing at more than twice that pace currently) with "fragmented" and "slow" per capita economic growth and technological change.

Indeed, it is just this scenario that was used by the influential Stern Report on the economic impact of climate change. By the year 2100, the size of the global economy would be $243 trillion. However, there is another IPCC scenario. It imagines "a future world of very rapid economic growth, low global population growth that peaks in mid-century and declines thereafter, and the rapid introduction of new and more efficient technologies." According to this story line, the global economy would grow at 3.5 percent per year, giving us a $550 trillion global economy in the year 2100, more than twice the size of the economy assumed in the first scenario.

I don’t know about you, but give me a century of accelerating technological change and $300 trillion to pay for it, and there are few problems that would keep me up at night. So the question is: Which policies will get us there?

A couple of years ago, people were all asking themselves what the world could do to avoid catastrophes like the Indonesian Tsunami.  I argued the best thing to do was to help poorer countries to develop as fast as possible. 

Ironically, the primary way to avoid such disasters is not by reversing human technology (as global warming activists want to do), but by increasing it, in the form of warning systems and evacuation routes.  Global warming advocates actually want to keep everyone poor – they blame wealth and progress for global warming, but note that wealthy countries like the US (the global warming great Satan) has had the technology and the wealth to afford to put systems in place that would have prevented such a huge death toll.  Wealth, prosperity and technology are what would have averted this disaster, and it is just these things that global warming advocates oppose for Southeast Asia.

Scientific Analisis of the Day

From Greenpeace:

Exxonprofitsandclimatechan

Gosh, its an amazing coincidence that the steps proposed to curb CO2 (reduce oil use, demonize oil companies, limit growth, increase government interventions in free economies, limit global trade) exactly match the political goals held by many leading climate catastrophists long before greenhouse gas theory was even born.  But I am sure its all about the science.  When I hear a climate catastrophist promoting nuclear energy to replace coal in electricity generation (the one no-brainer technology substitution we have available to us to reduce CO2 production), that is a person I can respect for their intellectual integrity.  Of course, I almost never hear it.

By the way, Greenpeace should have a picture of John D. Rockefeller,the founder of Standard Oil of New Jersey (and predecesor of Exxon) on the wall of every one of its offices.  Mr. Rockefeller and Standard Oil, by making Kerosene cheap and universally available as a luminant, did more than Greenpeace will ever do to save the whales.

Update:  The chart itself is kind of funny when you think about it.  It implies that increased prices for gas and oil, which increase profits, would also increase global warming.  But in fact, exactly the opposite is true.  As prices have risen, Exxon has made higher profits but demand has been reduced.  In fact, Exxon really "promoted" global warming the most in the 1980’s and 1990’s when they were making miserable profits and oil prices were low.

Example of A Temperature Proxy

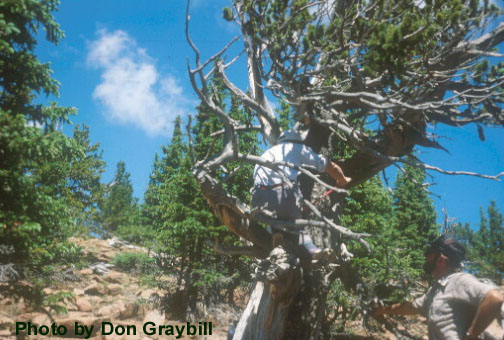
Many of you have probably read about the disputes over temeprature histories like Mann’s hockey stick chart.  I thought you might be interested in how some of these 1000-year long proxies are generated.  There are several different approaches, but one that Mann relied a great deal on is measuring tree rings in bristle cone pine trees.  Here is a picture of a researcher taking a core from a very old tree that is then sent to a lab to have it’s ring widths measured. 

Alm4

In theory, these ring widths are directly proportional to annual temepratures, but there are a lot of questions about whether this is really true.  Other factors, like changing precipitation patterns, might also affect ring widths, and there may be reasons why the scale could change over time.  Remember, we only have a few decades, at most, of good temperature data to scale growth in a tree that goes back over a thousand years.  In fact, scientists are finding that, more recently, tree ring proxy data for current growth is diverging from surface temperature data, meaning either that surface temperature data is flawed or that they don’t really understand how to scale tree ring data yet.  Interestingly, and as a sign of the health of climate science, researchers have reacted to this problem by … not updating tree ring proxy databases for recent years.  That’s one way to handle data that threatens your hypothesis — just refuse to collect it.  Much more on proxy histories here.

Why They Renamed it “Climate Change”

Global Warming was renamed "climate change" so that any "unusual" weather could be grouped under the banner and blamed on man as part of the general panic.  And, more specifically in this case, be used as an excuse to fund a little mountain climbing every year:

The Alps’ tallest peak was measured at 4,810.90 metres on September 15 and 16 – a 2.15 metre increase in two years, surveyors from France’s Haute-Savoie region announced.

"The height as well as the volume of Mont Blanc has increased considerably, because the snow has massed on the summit over the last two years," expert Philippe Borel said at a meeting in the Alpine town Chamonix.

When skeptics refute that many shrinking glaciers, such as the ice pack on Kilamanjaro, are due to changing winds and precipitation patterns rather than warming, they get ignored.  However, when ice is increasing, then of course the press blames it on winds and precipitation rather than cooling:

"We’re registering a greater frequency of winds from the west which bring rain and higher temperatures."

In the summer the precipitation translates into snow sticking in regions over 4,000 metres in altitude that increases Mont Blanc’s volume and height, Mr Giezendanner said.

Interestingly, that sounds a lot like this explanation for shrinking Arctic Ice, which most of the press did not see the need to report.

By the way, this story is an awesome illustration of the point I frequently make — that is, the hubris we have of declaring some weather pattern to be "abnormal" when in fact we only have been observing climate in any depth for a few decades.  Or in this case, for about 4 years:

The volume of ice on Mont Blanc’s slopes over 4,800 metres high was first calculated at 14,600 cubic metres in 2003.

It dropped to 14,300 cubic metres two years later, but then almost doubled to 24,100 cubic metres in 2007.

So for the whole history of time, we have three data points over 4 years for ice depth on Mt. Blanc.  How is there a story here at all, one way or another?

Postscript:  When I was a consultant at McKinsey, I used to joke that it is better to have just one data point rather than many, because then you could draw whatever curve or trendline you wanted to through that one point.

Al Gore and the Peace Prize

This morning I was all fired up to write something petty, like "Al Gore now has made the same contributions to peace as have previous winners Yassir Arafat and Henry Kissinger."  Later, I considered a long and drawn out post on the inaccuracies of "An Inconvinient Truth", but I really have already done that in long form here and in short form here.  In truth, the Peace prize process has for years been about a group of leftish statists making a statement, and often it has been about tweaking the US, rather than a dispassionate analysis of true contributions to peace made with the benefit of some historic distance (as is done with the scientific prizes).  Further, most folks I argue with don’t really care about the specific inacuracies in Gore’s movie, their response typically being something in the "fake but accurate" line of reasoning.

So instead I will say what I told a reader by email a few hours ago.  I tend to be optimistic about the world, and believe that we are approaching a high water mark (so to speak) for the climate catastrophists, where we will look back and see their influence peak and start unwinding under the presure of science and the reality of the enormous cost to abate CO2.  Gore’s Peace prize, in the same year as his Oscar and that global warming music festival no one can even remember the name of 3 months later, feels to me like it may be that high water mark.   The Peace Prize certainly was the high water mark for Jimmy Carter’s credibility, not to mention that of Henry Kissinger and a myriad of others.  Think of it this way — if the guys who made the peace prize decisions were investors, and you knew what they were investing in, you would sell short.  Seriously, just look at the group.  Well, they just invested in Al Gore.

Update:  One thing many commenters have not pointed out is that Al Gore is really manuevering the US and China and India (and the rest of the developping world) into a position that, if he has his way, conflict is going to occur over who gets to grow and develop, and who does not.  CO2 catastrophism has the ablility to be the single most destabalizing issue of the 21st century. This is peace?

The Studies Do No Such Thing

Today the USA Today announced in a headline:

Studies Link Man-Made Causes to Rise in Humidity

From the article:

One study, published in today’s edition of the journal Nature, found that the overall increase in worldwide surface humidity from 1973-99 was 2.2%, which is due "primarily to human-caused global warming," according to study co-author Nathan Gillett of the University of East Anglia, in Norwich, U.K.

Here is what makes me immediately suspicious, even at this point in the article:  No one can acurately come up with an empirical proof of how much of the warming from 1973-99 was due to man’s activities and how much was due to natural effects (the best you can find are studies that say "most" or "a lot of" or "some".  Therefore, it is impossible that anyone was able to attribute a humidity rise just to the man-made portion of the warming, since we don’t know how much that was.

Second, there are been a number of good studies that have shown that man can have a substantial effect on air humidity, but that these effects tend to be due to land use (e.g. agriculture, irrigation, urbanization, and even swimming pools) rather than CO2 caused warming.  To throw all of the humidity rise only on CO2, and not these other anthropogenic effects, seems facile.

So how did the study author’s get to their conclusions?

It turns out the only empirical work anyone did was measure humidity.  And yes, humidity did seem to go up over the these decades.  But this is the end of the empirical work in the studies. 

Both studies relied primarily on computer models of the Earth’s climate system to reach their conclusions.

Great.  For years I have called these computer models scientific money-laundering.  They take unproven assumptions, plug them into something they call a model, and then get results they claim to be proven.  They are washing garbage unproven assumptions through these black boxes and then calling them clean results on the back end.  Garbage In – Scientific Proof Out. It is crazy.  The models are built on the assumption that anthropogenic effects drive the climate, and so they therefore spit out the results that… anthropogenic effects drive the climate.

Roy Spencer, principal research scientist at the University of Alabama-Huntsville, says, "The main thing they’re trying to show is that the recent warming and moistening in the last 30 years is outside the range of natural variability, and that man is causing the warming. The use of climate models to do this is not convincing. … The idea that you can use climate models as a surrogate for reality is circular reasoning."

I often tell my friends that when you really flay away all the bullshit, the main argument by climate catastrophists for anthropogenic origens of climate change is that scientists "can’t think of anything else it can be."  In other words, having exhausted all the natural causes the current state of the science knows about, they assume the cause must be man.  My friends never believe me when I say this, but here is a climate scientist in his own words:

"Natural variability in climate just can’t explain this moisture change. The most plausible explanation is that it’s due to the human-caused increase in greenhouse gases," Santer says. His study also discounted influences from solar activity and the 1991 eruption of Mount Pinatubo.

This is the heart of the "link" trumpeted in the article’s headline — that scientists can’t imagine that the cause is natural varaiblity and that it is plausible man is the cause.  Wow, that’s good science.  And by the way, can you imagine if, say, astrophysics took the same approach?  "We don’t know of any natural phenomenon that would cause pulsars so they must be man-made."  This is science Percival Lowell would have loved.

The Cost of CO2 Abatement

I had an argument about global warming the other night with a couple of friends.  I achnowleged that the world was warming somewhat and some of that was due to man, but said that any rational estimate of future warming due to man’s efforts yielded forecasts far below the catastrophic levels espoused by Al Gore (and for which he will apparently win the Nobel Peace Prize on Friday).  Their response, which I have found to be typical, was 1) it doesn’t matter how much the warming is, it is bad to change the earth at all and 2) we need to aggresively fight CO2 "just in case" there is some catastrophic tipping point lurking out there.

The problem is that the costs of abating CO2 to any levels that might make a difference are both enormous and certain  (vs. global warming costs which may or may not be large and are uncertain).   Since fossil fuel production is intrinsic to economic growth, at least at current technology levels, large cuts in fossil fuel productions mean large cuts in world economic growth.  A reduction, for example, in economic growth by must 1 percentage point a year would reduce the size of the global economy by 2.5 times in a century.  And a one percentage point reduction is surely less than the true effect of the levels of CO2 cuts that catastrophists are petitioning for.

In particular, what is seldom mentioned, is that CO2 cuts of the kind suggested in Kyoto-type protocols are likely to lock over a billion people into poverty, just at the time when they are beginning to get their first experiences with prosperity.

In 2007, human beings will consume roughly 15 terawatts of energy worldwide. That level of energy use will rise rapidly over the next 100 years due to population growth and increasing living standards, especially among the global poor. By the year 2100, humankind will need to produce and consume roughly 60 terawatts of energy if every human on earth is to reach the level of prosperity enjoyed today by the world’s wealthiest one billion people. Even if economies were to become much more efficient, the total terawatts needed to bring all of humankind out of poverty would still need to roughly double by 2050 and triple by century’s end.

Eleven Inacuracies

A British Court, in response to a lawsuit aimed at blocking the showing of an Inconvinient Truth in British schools because it constituted political propoganda rather than good science, found 11 inacuracies in the film that the court said made the film of questionable educational value.  I could name a few others, but this is not a bad list:

  • he film claims that melting snows on Mount Kilimanjaro evidence global warming. The Government’s expert was forced to concede that this is not correct.
  • The film suggests that evidence from ice cores proves that rising CO2 causes temperature increases over 650,000 years. The Court found that the film was misleading: over that period the rises in CO2 lagged behind the temperature rises by 800-2000 years.
  • The film uses emotive images of Hurricane Katrina and suggests that this has been caused by global warming. The Government’s expert had to accept that it was "not possible" to attribute one-off events to global warming.
  • The film shows the drying up of Lake Chad and claims that this was caused by global warming. The Government’s expert had to accept that this was not the case.
  • The film claims that a study showed that polar bears had drowned due to disappearing arctic ice. It turned out that Mr Gore had misread the study: in fact four polar bears drowned and this was because of a particularly violent storm.
  • The film threatens that global warming could stop the Gulf Stream throwing Europe into an ice age: the Claimant’s evidence was that this was a scientific impossibility.
  • The film blames global warming for species losses including coral reef bleaching. The Government could not find any evidence to support this claim.
  • The film suggests that the Greenland ice covering could melt causing sea levels to rise dangerously. The evidence is that Greenland will not melt for millennia.
  • The film suggests that the Antarctic ice covering is melting, the evidence was that it is in fact increasing.
  • The film suggests that sea levels could rise by 7m causing the displacement of millions of people. In fact the evidence is that sea levels are expected to rise by about 40cm over the next hundred years and that there is no such threat of massive migration.
  • The film claims that rising sea levels has caused the evacuation of certain Pacific islands to New Zealand. The Government are unable to substantiate this and the Court observed that this appears to be a false claim.
  • Trillions of Dollars, Tenths of a Degree

    One of my frustrations in arguing that anthropogenic global warming forecasts are exaggerated is that people usually respond, "well, we should do something anyway just in case."  As if the cost of abatement were nearly free.  But the one thing we know is that any meaningul abatement of CO2 production will be extraordinarily costly to the world economy, and will have real and predicatable impacts on poverty and development. 

    We are perhaps fooled by past efforts at reducing pollution, where we have greatly improved air and water quality when we wanted to.  The elimination of SO2 pollution is one example.  But the difference is that these ancillary pollutants were not fundamental to the combustion process.  Hydrocarbons + O2 ==> CO2 + H2O.   Key pollutants we have fought in the past — ozone, SO2, NO2 — are not core to the combustion process.  They can be managed through cleaner fuels, some filtering, and better control of the combustion process itself.  CO2 is different.  There is no practical way to filter it cheaply.  The only real way to eliminate it is not to burn hyrdrocarbons.

    As a result, small improvements in CO2 levels require enormous investments:

    Last July, this column reported that the latest global warming bill — the Low Carbon Economy Act of 2007, introduced by Sens. Jeff Bingaman, D-N.M. and Arlen Specter, R-Pa. — would cost taxpayers more than $1 trillion in its first 10 years and untold trillions of dollars in subsequent decades.

    This week, the EPA sent its analysis of the bill’s impact on climate to Bingaman and Specter. Now we can see what we’d get for our money, and we may as well just build a giant bonfire with the cash and enjoy toasting marshmallows over it.

    For reference purposes, the current level of carbon dioxide in the atmosphere is about 380 parts per million. The EPA estimates that if no action is taken to curb CO2 emissions, the atmospheric concentration of CO2 would be 718 ppm by 2095.

    If the Bingaman-Specter bill were implemented, however, the EPA estimates that CO2 levels would be 695 ppm — a whopping reduction of 23 ppm….

    Although the EPA didn’t pursue its analysis that far, figuring out the implications are readily doable using the assumptions and formulas of the United Nations’ Intergovernmental Panel on Climate Change. Under the no-action scenario (718-to-695 ppm), the IPCC formulas indicate that the multitrillion-dollar Bingaman-Specter bill might reduce average global temperature by 0.13 degrees Celsius.

    Under the maximum regulation scenario (514-to-491 ppm), Bingaman-Specter might reduce average global temperature by 0.18 degrees Celsius. Actual temperature reductions are likely to be less since these estimates rely on the IPCC’s alarmist-friendly assumptions and formulas.

    By the way, the figure of 718ppm by 2095 is wildly overstated.  CO2 increased about 90ppm in the last 120 years, and it take wildly aggresive forecats to have it increase by 340ppm in the next 75-80 years.  More on that topic here.

    Wind Patterns May Be Responsible for Arctic Sea Ice Loss

    From the NASA webs site, with a hat tip to the Reference Frame:

    A new NASA-led study found a 23-percent loss in the extent of the Arctic’s thick, year-round sea ice cover during the past two winters. This drastic reduction of perennial winter sea ice is the primary cause of this summer’s fastest-ever sea ice retreat on record and subsequent smallest-ever extent of total Arctic coverage. …

    Nghiem said the rapid decline in winter perennial ice the past two years was caused by unusual winds. "Unusual atmospheric conditions set up wind patterns that compressed the sea ice, loaded it into the Transpolar Drift Stream and then sped its flow out of the Arctic," he said. When that sea ice reached lower latitudes, it rapidly melted in the warmer waters.

    "The winds causing this trend in ice reduction were set up by an unusual pattern of atmospheric pressure that began at the beginning of this century," Nghiem said.

    The Arctic Ocean’s shift from perennial to seasonal ice is preconditioning the sea ice cover there for more efficient melting and further ice reductions each summer. The shift to seasonal ice decreases the reflectivity of Earth’s surface and allows more solar energy to be absorbed in the ice-ocean system.

    Climate is complicated, so there may still be more to the phenomenon than we understand today, but certainly this is a more satisfying answer the "global warming" since Antarctic sea ice was hitting a 30 year high at the same time Arctic ice was at a 30-year low.

    One of my favorite topics in climate discussion is "what is normal?"  We have observed climate really intensely for maybe 30 years, and with any kind of reliable measurements for no more than about a hundred years.  So given that climate moves in hundred thousand and million year cycles, how can we be sure our reference point, given 30 years of observation, is really "normal."  One funny aspect of this is how often the headline has been flashed over the last few weeks that Arctic ice is at an "all-time" low.  Really?  You mean the lowest it has been in the 6 billion year history of earth?  Well, no, just the lowest since 1979 when we started measuring by sattelite.  (For those without a calculator, "since 1979" is really only 0.0000005% of "all-time.")

    Update:  Anthony Watt has much more

    Are Pirates Behind Global Warming?

    The LA Times had a great article on correlations and causations:

    AGITTARIANS are 38% more likely to break a leg than people of other star signs — and Leos are 15% more likely to suffer from internal bleeding. So says a 2006 Canadian study that looked at the reasons residents of Ontario province had unplanned stays in the hospital.

    Leos, Sagittarians: There’s no need to worry. Even the study’s authors don’t believe their results.

    They’re illustrating a point — that a scientific approach used in many human studies often leads to findings that are flat-out wrong.

    Such studies make headlines every day, and often, as the public knows too well, they contradict each other. One week we may hear that pets are good for your health, the next week that they aren’t. One month, cellphone use causes brain cancer; the next month, it doesn’t.

    “It’s the cure of the week or the killer of the week, the danger of the week,” says Dr. Barry Kramer, associate director for disease prevention at the National Institutes of Health in Bethesda, Md. It’s like treating people to an endless regimen of whiplash, he says.

    Take the case of just one item: coffee. Drinking two or three cups per day can triple the risk of pancreatic cancer, according to a 1981 study. Not so, concluded a larger follow-up study published in 2001.

    Coffee reduces the risk of colorectal cancer, found a 1998 study. Not so, according to one published later, in 2005.

    “I’ve seen so many contradictory studies with coffee that I’ve come to ignore them all,” says Donald Berry, chair of the department of biostatistics at the University of Texas MD Anderson Cancer Center in Houston.

    I wrote about some similar examples in my guide to global warming, in the chapter on the dangers of modelling based on past regression data:

    How is it possible that a model that accurately represents the past fails to accurately predict the future?  Financial modelers, like climate modelers, look to history in building their models.  Again, like climate modelers, they rely both on theory (e.g. higher interest rates should generally mean lower stock prices) as well as observed correlations in the historic data set.  The problem they meet, the problem that every modeler meets but most especially the climate modeler, is that while it is easy to use various analysis tools to find correlations in the data, there is often nothing that will tell you if there is really a causal relationship, and which way the causality runs. For example, one might observe that interest rates and exchange rates move together.  Are interest rate changes leading to exchange rate adjustments, or vice versa?  Or, in fact, are they both caused by a third variable?  Or is their observed correlation merely coincidence?

    It was once observed that if an old AFL football team wins the Superbowl, a bear market will ensue on Wall Street in the next year, while an NFL team victory presaged a bull market.  As of 1997, this correlation held for 28 of the last 31 years, a far better prediction record than that of any Wall Street analyst.  But of course this correlation was spurious, and in the next 4 years it was wrong every time.  Had someone built a financial model on this indicator, it would have looked great when he ran it against history, but he would have lost his shirt using it. 

    Want a better prediction record?  For seventeen straight US presidential election cycles, from 1936 to 2000, the winner of the election was accurately predicted by…the Washington Redskins.  In particular, if the Redskins won their last home game before the election, the party that occupies the White House holds it in the election.  Otherwise, if the Redskins lose, the opposition party wins.  Seventeen in a row!  R-squared of one!  Success against odds of 131,072:1 of guessing all 17 right. But of course, the input was spurious, and in 2004, soon after this relationship made the rounds of the Internet, the algorithm failed.

    Note that the historic relationship between football and elections is much stronger than the historic relationship between global warming and CO2.  In the last 12 decades, CO2 levels and temepratures have only moved in the same direction in half the decades. 

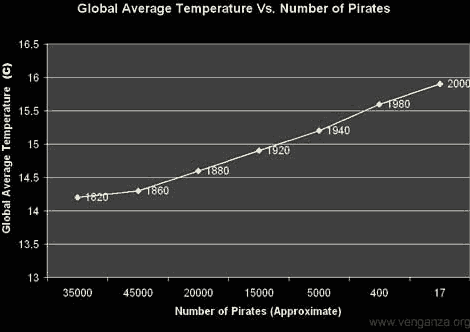
    Finally, as promised in the title of this post, here is the stunning relationship between global warming and the number of pirates in the world, via the Conspiracy to Keep You Poor and Stupid:

    200760920pirate