Category Archives: Other Causes of Warming

On Muller

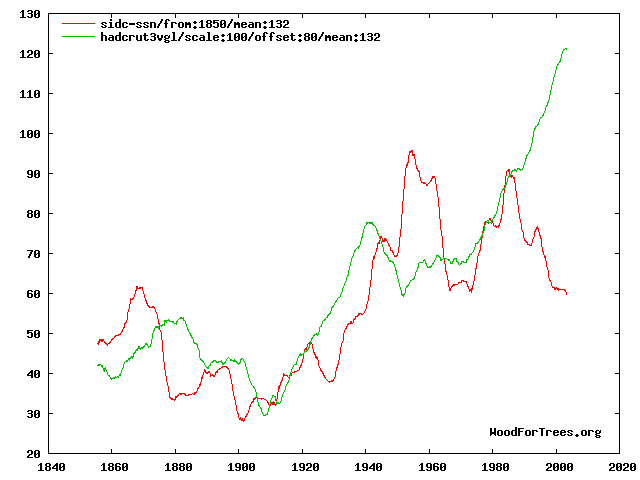
Kevin Drum approvingly posted this chart from Muller:

I applaud the effort to match theory to actual, you know, observations rather than model results.  I don’t have a ton of time to write currently, but gave some quick comments:

1.  This may seem an odd critique, but the fit is too good.  There is no way that in a complex, chaotic system only two variables explain so much of a key output.    You don’t have to doubt the catastrophic anthropogenic global warming theory to know that there are key variables that have important, measurable effects on world temperatures at these kind of timescales — ocean cycles come to mind immediately — which he has left out.   Industrial-produced cooling aerosols, without which most climate models can’t be made to fit history, are another example.  Muller’s analysis is like claiming that stock prices are driven by just two variables without having considered interest rates or earning in the analysis.

2.  Just to give one example critique of the quality of “science” being held up as an example, any real scientist should laugh at the error ranges in this chart.   The chart shows zero error for modern surface temperature readings.  Zero.  Not even 0.1F.    This is hilariously flawed.  Anyone who went through a good freshman physics or chemistry lab (ie many non-journalists) will have had basic concepts of errors drilled into them.  An individual temperature instrument probably has an error when perfectly calibrated of say 0.2F at best.  In the field, with indifferent maintenance and calibration, that probably raises to 0.5F.  Given bad instrument sitings, that might raise over 1F.  Now, add all those up, with all the uncertainties involved in trying to get a geographic average when, for example, large swaths of the earth are not covered by an official thermometer, and what is the error on the total?  Not zero, I can guarantee you.  Recognize that this press blitz comes because he can’t get this mess through peer review so he is going direct with it.

3. CO2 certainly has an effect on temperatures, but so do a lot of other things. The science that CO2 warms the Earth is solid. The science that CO2 catastrophically warms the Earth, with a high positive feedback climate system driven to climate sensitivities to CO2 of 3C per doubling or higher is not solid. Assuming half of past warming is due to man’s CO2 is not enough to support catastrophic forecasts. If half of past warming, or about .4C is due to man, that means climate sensitivity is around 1C, exactly the no-feedback number that climate skeptics have thought it was near for years. So additional past man-made warming has to be manufactured somehow to support the higher sensitivity, positive feedback cases.

Judith Curry has a number of comments, including links to what she considers best in class for this sort of historic reconstruction.

Update: Several folks have argued that the individual instrument error bars are irrelevant, I suppose because their errors will average. I am not convinced they average down to zero, as this chart seems to imply. But many of the errors are going to be systematic. For example, every single instrument in the surface average have manual adjustments made in multiple steps, from TOBS to corrections for UHI to statistical homogenization. In some cases these can be calculated with fair precision (e.g. TOBS) but in others they are basically a guess. And no one really knows if statistical homogenization approaches even make sense. In many cases, these adjustments can be up to several times larger in magnitude than the basic signal one is trying to measure (ie temperature anomaly and changes to it over time). Errors in these adjustments can be large and could well be systematic, meaning they don’t average out with multiple samples. And even errors in the raw measurements might have a systematic bias (if, for example, drift from calibration over time tended to be in one direction). Anthony Watt recently released a draft of a study I have not read yet, but seems to imply that the very sign of the non-TOBS adjustments is consistently wrong. As a professor of mine once said, if you are unsure of the sign, you don’t really know anything.

Did CLOUD Just Rain on the Global Warming Parade?

Today in Forbes, I have an article bringing the layman up to speed on Henrik Svensmark and this theory of cosmic ray cloud seeding.  Since his theory helped explain some 20th century warming via natural effects rather than anthropogenic ones, he and fellow researchers have face an uphill climb even getting funding to test his hypothesis.  But today, CERN in Geneva has released study results confirming most of Svensmark’s hypothesis, though crucially, it is impossible to infer from this work how much of 20th century temperature changes can be traced to the effect (this is the same problem global warming alarmists face — CO2 greenhouse warming can be demonstrated in a lab, but its hard to figure out its actual effect in a complex climate system).

From the article:

Much of the debate revolves around the  role of the sun, and though holding opposing positions, both skeptics and alarmists have had good points in the debate.  Skeptics have argued that it is absurd to downplay the role of the sun, as it is the energy source driving the entire climate system.  Michael Mann notwithstanding, there is good evidence that unusually cold periods have been recorded in times of reduced solar activity, and that the warming of the second half of the 20th century has coincided with a series of unusually strong solar cycles.

Global warming advocates have responded, in turn, that while the sun has indeed been more active in the last half of the century, the actual percentage change in solar irradiance is tiny, and hardly seems large enough to explain measured increases in temperatures and ocean heat content.

And thus the debate stood, until a Danish scientist named Henrik Svensmark suggested something outrageous — that cosmic rays might seed cloud formation.  The implications, if true, had potentially enormous implications for the debate about natural causes of warming.

When the sun is very active, it can be thought of as pushing away cosmic rays from the Earth, reducing their incidence.  When the sun is less active, we see more cosmic rays.  This is fairly well understood.  But if Svensmark was correct, it would mean that periods of high solar output should coincide with reduced cloud formation (due to reduced cosmic race incidence), which in turn would have a warming effect on the Earth, since less sunlight would be reflected back into space before hitting the Earth.

Here was a theory, then, that would increase the theoretical impact on climate of an active sun, and better explain why solar irradiance changes might be underestimating the effect of solar output changes on climate and temperatures.

I go on to discuss the recent CERN CLOUD study and what it has apparently found.

A Thought on “Short Term”

One interesting fact is that alarmists have to deal with the lack of warming or increase in ocean heat content over the last 12 years or so.  They will argue that this is just a temporary aberration, and a much shorter time frame than they are working on.    Let’s think about that.

Here is the core IPCC argument:  for the period after 1950, they claim their computer models cannot explain warming patterns without including a large effect from anthropogenic CO2.  Since almost all the warming in the latter half of the century really occurred between 1978 and 1998, the IPCC core argument boils down to “we are unable to attribute the global temperature increase in these 20 years to natural factors, so it must have been caused by man-made CO2.”  See my video here for a deeper discussion.

In effect, the core IPCC conclusions were really based on the warming over the 20 years from 1978-1998.  There was never any implication that their models couldn’t explain, say, the 1930’s or the 1970’s without manmade CO2.

So while 12 years is admittedly short compared to many natural cycles in climate, and might be considered a dangerously short period to draw conclusions from, it is fairly large compared to the 20 year period that drove the IPCC conclusions.

Here is where we stand:  The IPCC models supposedly cannot explain the 20 year period from 1978-1998 without factoring in a high climate sensitivity to CO2.  However, I would venture to guess that, prior to tweaking, the IPCC models cannot explain the 12 year period from 1998-2011 while still factoring in a high climate sensitivity to CO2.

Postscript:  I suppose the IPCC would scream “aerosols,” but even putting aside the equivocal and sometimes offsetting effects of aerosols and black carbon, I do not think one could reasonably argue their effect was much greater in one period than the other.

Oh, Maybe Ocean Oscillations are Important

From an interview with Judith Curry

They don’t disprove anthropogenic global warming, but we can’t airbrush them away. We need to incorporate them into the overall story. We had two bumps—in the ’90s and also in the ’30s and ’40s—that may have had the same cause. So we may have exaggerated the trend in the later half of the 20th century by not adequately interpreting these bumps from the ocean oscillations. I don’t have all the answers. I’m just saying that’s what it looks like.

The bump in the 90’s is important because its slope is considered exhibit A in the evidence for strong anthropogenic global warming by alarmist scientists.  Climate scientists have argued that the “bump” is so steep that it could not be natural and has to be man made.

I am not going to diss on Ms. Curry, as she is in the minority of climate scientists who don’t treat scientific disagreements as proof of evil conspiracies.  I often say that reasonable people can disagree, and she seems to approach scientific debate in this manner, rather than as a quest for religious conformity.

However, how much of a pass do we really give climate scientists for missing something so obvious as ocean cycles, particularly since even untrained amateurs like myself have been pointing out this omission for years.   For example:

Hmm, the 90’s seem suddenly less unprecedented.  In fact, from here, there seem to be a lot of bumps:

Period Length Trend
(Degrees C per decade)
Significance
1860-1880 21 0.163 Yes
1910-1940 31 0.15 Yes
1975-1998 24 0.166 Yes
1975-2009 35 0.161 Yes

In fact, one can model past temperatures as a linear trend  (that started well before CO2 was added in any substantial quantity) and periodic bumps

I wonder what periodic effect could be causing the bumps?

Even leaving out the AMO and other cycles and just simplifying to the PDO, it sees that ocean cycles might be important.  Again, temperatures over the last 100+ years look a lot like a linear trend plus ocean  cycle-driven bumps

Warming and Soot

A while back I advanced the hypothesis that soot was a major driver of sea ice melting in the Arctic.  Black carbon deposits on ice and snow tend to force them to melt much faster by reducing their albedo.  I hypothesized that this might explain why there were record low summer sea ice coverages of late in Arctic sea ice but relatively average winter sea ice extents — black carbon can’t build up in the fall and winter because they are constantly covered with new snow and ice while soot that falls in the summer stays on the surface.

By the way, this would be good news – an anthropogenic effect due to soot is MUCH easier to correct than one due to CO2, as we know how to have a prosperous fossil fuel powered economy without soot but we don’t know how to have one without CO2.

Kevin Lawton has a post correlating past warming with areas that are susceptible to thaws, concluding that black carbon may have a role in past warming.  I have to think about his argument more, but he has some good links to recent work on black carbon and warming.

Good News / Bad News for Media Science

The good news:  The AZ Republic actually published a front page story (link now fixed) on the urban heat island effect in Phoenix, and has a discussion of how changes in ground cover, vegetation, and landscaping can have substantial effects on temperatures, even over short distances.  Roger Pielke would be thrilled, as he has trouble getting even the UN IPCC to acknowledge this fact.

The bad news:  The bad news comes in three parts

  1. The whole focus of the story is staged in the context of rich-poor class warfare, as if the urban heat island effect is something the rich impose on the poor.  It is clear that without this class warfare angle, it probably would never have made the editorial cut for the paper.
  2. In putting all the blame on “the rich,” they miss the true culprit, which are leftish urban planners whose entire life goal is to increase urban densities and eliminate suburban “sprawl” and 2-acre lots.  But it is the very densities that cause the poor to live in the hottest temperatures, and it is the 2-acre lots that shelter “the rich” from the heat island effects.
  3. Not once do the authors take the opportunity to point out that such urban heat island effects are likely exaggerating our perceptions of Co2-based warming — that in fact some or much of the warming we ascribe to Co2 is actually due to this heat island effect in areas where we have measurement stations.

My son and I quantified the Phoenix urban heat island years ago in this project.

I am still wondering why Phoenix doesn’t investigate lighter street paving options.  They use all black asphalt, and just changing this approach (can you have lighter asphalt?) would be a big help.  By the way, our house is all white with a white foam roof, so we are doing our part to fight the heat island!

GCCI #9: Forcing Observation to Fit the Theory

Let me digress a bit.  Just over 500 years ago, Aristotelian physics and mechanical models still dominated science.  The odd part about this was not that people were still using his theories nearly 2000 years after his death — after all, won’t people still know Isaac Newton’s contributions a thousand years hence?  The strange part was that people had been observing natural effects for centuries that were entirely inconsistent with Aristotle’s mechanics, but no one really questioned the underlying theory.

But folks found it really hard to question Aristotle.  The world had gone all-in on Aristotle.  Even the Church had adopted Aristotle’s description of the universe as the one true and correct model.  So folks assumed the observations were wrong, or spent their time shoe-horning the observations into Aristotle’s theories, or just ignored the offending observations altogether.  The Enlightenment is a complex phenomenon, but for me the key first step was the willingness of people to start questioning traditional authorities (Aristotle and the church) in the light of new observations.

I am reminded of this story a bit when I read about “fingerprint” analyses for anthropogenic warming.  These analyses propose to identify certain events in current climate (or weather) that are somehow distinctive features of anthropogenic rather than natural warming.  From the GCCI:

The earliest fingerprint work focused on changes in surface and atmospheric temperature. Scientists then applied fingerprint methods to a whole range of climate variables, identifying human-caused climate signals in the heat content of the oceans, the height of the tropopause (the boundary between the troposphere and stratosphere, which has shifted upward by hundreds of feet in recent decades), the geographical patterns of precipitation, drought, surface pressure, and the runoff from major river basins.

Studies published after the appearance of the IPCC Fourth Assessment Report in 2007 have also found human fingerprints in the increased levels of atmospheric moisture (both close to the surface and over the full extent of the atmosphere), in the decline of Arctic sea ice extent, and in the patterns of changes in Arctic and Antarctic surface temperatures.

This is absolute caca.  Given the complexity of the climate system, it is outright hubris to say that things like the “geographical patterns of precipitation” can be linked to half-degree changes  in world average temperatures.  But it is a lie to say that it can be linked specifically to human-caused warming, vs. warming from other causes, as implied in this statement.   A better name for fingerprint analysis would be Rorschach analysis, because they tend to result in alarmist scientists reading their expectation to find anthropogenic causes into every single weather event.

But there is one fingerprint prediction that was among the first to be made and is still probably the most robust of this genre:  that warming from greenhouse gasses will be greatest in the upper troposphere above the tropics.  This is demonstrated by this graph on page 21 of the GCCI

fingerprint

This has always been a stumbling block, because satellites, the best measures we have on the troposphere, and weather balloons have never seen this heat bubble over the tropics.  Here is the UAH data for the mid-troposphere temperature — one can see absolutely no warming in a zone where the warming should, by the models, be high:

mid-trop

Angell in 2005 and Sterin in 2001 similarly found from Radiosonde records about 0.2C of warming since the early 1960s, below the global surface average warming when models say it should be well above.

But fortunately, the GCCI solves this conundrum:

For over a decade, one aspect of the climate change story seemed to show a significant difference between models and observations.

In the tropics, all models predicted that with a rise in greenhouse gases, the troposphere would be expected to warm more rapidly than the surface. Observations from weather balloons, satellites, and surface thermometers seemed to show the opposite behavior (more rapid warming of the surface than the troposphere). This issue was a stumbling block in our understanding of the causes of climate change. It is now largely resolved.   Research showed that there were large uncertainties in the satellite and weather balloon data. When uncertainties in models and observations are properly accounted for, newer observational data sets (with better treatment of known problems) are in agreement with climate model results.

What does this mean?  It means that if we throw in some correction factors that make observations match the theory, then the observations will match the theory.  This statement is a pure out and out wishful thinking.  The charts above predict a 2+ degree F warming in the troposphere from 1958-1999, or nearly 0.3C per decade.  No study has measured anything close to this  – Satellites show 0.0C per decade and radiosondes about 0.05C per decade.    The correction factors to make reality match the theory would have to be 10 times the measured anomaly.  Even if this were the case, the implied signal to noise ratio would be so low as to render the analysis meaningless.

Frankly, the statement by these folks that weather balloon data and satellites have large uncertainties is hilarious.  While this is probably true, these uncertainties and inherent biases are DWARFED by the biases, issues, uncertainties and outright errors in the surface temperature record.  Of course, the report uses this surface temperature record absolutely uncritically, ignoring a myriad of problems such as these and these.  Why the difference?  Because observations from the flawed surface temperature record better fit their theories and models.  Sometimes I think these guys should have put a picture of Ptolemy on their cover.

GCCI #7: A Ridiculously Narrow Time Window – The Sun

In a number of portions of the report, graphs appear trying to show climate variations in absurdly narrow time windows.  This helps the authors  either a) blame long-term climate trends on recent manmade actions or b) convert natural variation on decadal cycles into a constant one-way trend.  In a previous post I showed an example, with glaciers, of the former.  In this post I want to discuss the latter.

Remember that the report leaps out of the starting gate by making the amazingly unequivocal statement:

1. Global warming is unequivocal and primarily human-induced. Global temperature has increased over the past 50 years. This observed increase is due primarily to human induced emissions of heat-trapping gases.

To make this statement, they must dispose of other possible causes, with variations in the sun being the most obvious.  Here is the chart they use on page 20:

sun-short

Wow, this one is even shorter than the glacier chart.  I suppose they can argue that it is necessarily so, as they only have satellite data since 1978.  But there are other sources of data prior to 1978 they could have used**.

I will show the longer view of solar activity in a minute, but let’s take a minute to think about the report’s logic.  The chart tries to say that the lack of a trend in the rate of solar energy reaching Earth is not consistent with rising temperatures.  They are saying – See everyone, flat solar output, rising temperatures.  There can’t be a relationship.

Really?  Did any of these guys take basic thermodynamics?  Let’s consider a simple example from everyone’s home — a pot on a stove.  The stove is on low, and the water has reached an equilibrium temperature, well below boiling.  Now we turn the stove up — what happens?

water-stove1

In this chart, the red is the stove setting, and we see it go from low to high.  Prior to the change in stove setting, the water temperature in the pot, shown in blue, was stable.  After the change in burner setting, the water temperature begins to increase over time.

If we were to truncate this chart, so we only saw the far right side, as the climate report has done with the sun chart, we would see this:

water-stove2

Doesn’t this look just a little like the solar chart in the report?  The fact is that the chart from the report is entirely consistent both with a model where the sun is causing most of the warming and one where it is not.  The key is whether the level of the sun’s output from 1987 to present is a new, higher plateau that is driving temperature increases over time (like the higher burner setting) or whether the sun’s output recently is consistent with, and no higher than, its level over the last 100 years.  What we want to look for, in seeking the impact of the sun, is a step-change in output near when temperature increases of the last 50 years began.

Does such a step-change exist?  Yes.  One way to look at the sun’s output is to use sunspots as a proxy for output – the more spots in a given 11 year cycle, the greater the sun’s activity and likely output.  Here is what we see for this metric:

sunspot2-500x310

And here is the chart for total solar irradiance (sent to me, ironically, by someone trying to disprove the influence of the sun).

unsync

Clearly the sun’s activity and output experienced an upwards step-change around 1950.  The average monthly sunspots in the second half of the century were, for example, 50% higher than in the first half of the century.

The real question, of course, is whether these changes result in large or small rates of temperature increase.  And that is still open for debate, with issues like cloud formation thrown in for complexity.  But it is totally disingenuous, and counts on readers to be scientifically illiterate, to propose that the chart in the report “proves” that the sun is not driving temperature changes.

**By this logic, they should only have temperature data since 1978 for the same reason, though by one of those ironies I am starting to find frequent in this report, all the charts, including this one, use flawed surface temperature records rather than satellite data.  Why didn’t they use satellite data for the temperature as well as the solar output for this chart?  Probably because the satellite data does not include upward biases and thus shows less warming.  Having four or five major temperature indices to choose from, the team writing this paper chose the one that gives the highest modern warming number.

Thinking About the Sun

A reader wrote me a while back and asked if I could explain how I thought the sun could be a major driver of climate when temperature and solar metrics appear to have “diverged” as in the following two charts:

unsync

In both charts, red is the solar metric (TSI in the first chart, sunspot number in the second).  The other line, either blue or green, is a global temperature metric.  In both cases, we see a sort of step change in solar output, with the first half of the century at one plateau and the second half on a higher plateau.  This chart of sunspot numbers may better illustrate this:

I had three answers for the reader:

  1. In any sufficiently chaotic and complicated system, no one variable is going to consistently regress perfectly with another variable.  CO2 does not line up with temperature any better.
  2. There are non-solar factors at work.  As I have said on any number of occasions, I agree that the greenhouse effect of CO2 exists and will add about 1C for each doubling of CO2.  What I disagree with is the proposition that the Earth’s climate is dominated by positive feedback that multiplies this temperature increase 3-5 or more times.  The PDO cycle is another example of a process that affects global temperatures.
  3. One should not necessarily expect a linear temperature increase to be driven by a linear increase in the sun’s output.   I will illustrate this with a simplistic example, and then invite further comment.   I believe the following is a correct illustration of one heat source -> temperature phenomenon.  If so, wouldn’t we expect something similar with step-change increases in the sun’s output, and doesn’t this chart look a lot like the charts with which I began the post?

water-stove-climate

Who is Being Facile?

I very seldom go wallowing about responding to comments in my comment threads.  As I have posted before, I try to learn from criticisms in the comments and improve or modify my positions next time I post on a similar subject.  Besides, I would lose my life to playing the troll game on climate issues.

However, I am sitting at home with some time on my hands and thought I would address a representative critical comment, from this post on the sun.  Take this post as evidence, I guess, that I am perfectly capable of responding in depth to criticisms in the comments, had I this much time to spend with every one.

Staggering. You obviously haven’t read a single scholarly paper on this, or even looked at the data. This graph should dispel all your wrong-headed thinking. It’s the temperature, and monthly sunspot numbers, both plotted as 11 year running means (and scaled so that they roughly align). How, exactly, did rising temperatures in 1920 trigger increased solar activity 10 years later? Why did a peak in solar activity in the 1950s not correspond to a rise in temperatures then? Why do the green line and the red line diverge so wildly after 1985? Why is there basically hardly any correlation between solar activity and temperatures, over the last 150 years?

You betray a great immaturity on this web page, regurgitating the same nonsense time and again, calling people ‘morons’ and never even having the courtesy to respond when people tell you you’re wrong. When a fellow denialist tells you you’ve misrepresented him, and you don’t even bother to reply, let alone correct your error, what becomes crystal clear is that you’re simply dishonest.

A couple of responses:

  1. One of the great things about WordPress is that I have a nifty and powerful site search plugin (called Search Regex).  I just searched every post on this site.  The word “moron” has never, ever appeared on this site in text I have written.   She puts moron in quotes, but I am fairly certain she is not quoting me.  According to a Google search of this site, “moron” does appear 20-30 times in the comment section, usually wielded by my critics.
  2. When folks email me that I have made a mistake in quoting them, I post an update 100% of the time.  However, I occasionally miss such notifications if they are posted the comments and not emailed to me.  Believe it or not, I can go days without even glancing at this site or thinking about climate when the real job intervenes.  But that is what comments are for.  Unlike other climate sites that will remain nameless, *cough* realclimate *cough* I don’t moderate any comments, good, bad, or indifferent, except to eliminate outright spam.  If you disagree or I screwed up, that’s what the comments are there for.
  3. The commenter argues that I am simplistic and immature in this post.  I find this odd, I guess, for the following reason:  One group out there tends to argue that the sun is largely irrelevant to the past century’s temperature increases.  Another argues that the sun is the main or only driver.  I argue that the evidence seems to point to it being a mix, with the sun explaining some but not all of the 20th century increase, and I am the one who is simplistic?  Just for the record, I actually began the post with this:

    “I wouldn’t say that I am a total sun hawk, meaning that I believe the sun and natural trends are 100% to blame for global warming. I don’t think it unreasonable to posit that once all the natural effects are unwound, man-made CO2 may be contributing a 0.5-1.0C a century trend”

  4. The commenter links to this graph, which I will include.  It is a comparison of the Hadley CRUT3 global temperature index (green) and sunspot numbers (red):

    mean-1321

    Since I am so ridiculously immature, I guess I don’t trust myself to interpret this chart, but I would have happily used this chart myself had I had access to it originally (The chart uses a trailing 12 average of temperature as well as sunspots, which is why the line does not flatten and fall at the end.  I have to think a bit if I accept this metric as the correct comparison).

    It is wildly dangerous to try to visually interpret data and data correlations, but I don’t think it is unreasonable to say that there might be a relationship between these two data sets.  Certainly not 100%, but then again the same could easily be said of the relationship of temperature to Co2.  The same type of inconsistencies the commenter points out in this correlation could easily be made for Co2 (e.g., why, if CO2 was increasing, and in fact accelerating, were temps in 1980 lower than 1940?The answer, of course, is that climate is complicated.  But I see nothing in this chart that is inconsistent with the hypothesis that the sun might have been responsible for perhaps half of the 20th century warming.  And if Co2 is left with credit for just 0.3-0.4C warming over the last century, it is a very tough road to get from this past warming to sensitivities as high as 3C or greater.  I have all along contended that Co2 will likely drive 0.5-1.0C warming over the next century, and see nothing in this chart that makes me want to change that prediction.

  5. I was playing around a bit more, and found adding in PDO cycles fairly interesting (really this should be some combined AMO/PDO metric, and the exact dates of PDO reversals can be argued about, but I was going for quick and dirty).  Here is what I got:

    temp_spots_with_pdo

    If I wanted to make the same kind of observations as the commenter, I could say that temperature outpaced the sun during PDO warm phases and lagged the sun during cool phases, about what one would expect.  Again, I firmly believe there is still a positive warming trend when you take out cycles like the PDO and effects of the sun and other such influences — but that trend, even if all due to CO2, appears to be far below catastrophic sensitivity levels.

  6. It is kind of ironic that the post was actually not an in-depth analysis of solar cycles, but merely a statement of a hypothesis that solar activity level rather than the trend in solar activity should be regressed against temperature changes.  This seems like a fair hypothesis — one only has to think of a burner on a stove to understand it — but the commenter ignored it.  In fact, the divergence she points to in the late 1990’s is really exactly to the point.   Should a decreased solar output yield decreased temperatures?  Or, if that output is still higher than a historical average, will it still drive temperatures higher?  The answer likely boils down to how fast equilibrium is reached, and I don’t know the answer, nor do I think anyone else does either.
  7. I ask that people use their terms carefully.  I am not a “denialist” if that is meant to mean that I deny any anthropogenic effects on temperature or climate.  I am a denialist if that is meant to mean that I deny that warming from anthropogenic Co2 will cause catastrophic impacts that will outweigh the cost of Co2 abatement.

Updates: OK, I see that in the post in question, one of the quotes from another source used the word “morons.”  For those not experienced with reading blogs, indented text is generally quoted material from another source.  I guess I now understand the confusion — I stand by my statement, though, that I never use such terms in my own writing.  It is not the style I try to adopt on this blog.  Writers I quote have their own style, and my quoting them does not necesarily mean I totally agree with them, merely that the point they are making is somehow thought-provoking or one I want to comment on, extend, or rebut.

Black Carbon and Arctic Ice

My company runs a snow play area north of Flagstaff, Arizona.  One of the problems with this location is that the main sledding runs are on a black cinder hill.  Covered in snow, this is irrelevant.  But once the smallest hole opens up to reveal the black cinders underneath, the hole opens and spreads like crazy.  The low albedo cinders absorb heat much faster than reflective white snow, and then spread that heat into the snow and melts it.

Anthony Watt does an experiment with ash and snow in his backyard, and the effects are dramatic.

Even tiny amounts of soot pollution can induce high amounts of melting. There is little or no ash at upper right.. Small amounts of ash in the lower and left areas of the photo cause significant melting at the two-hour mark in the demonstration.

I won’t steal his thunder by taking his pictures, but you should look at them — as the saying goes, they are worth a thousand words.

We know that Chinese coal plants pump out a lot of black carbon soot that travels around the world and deposits itself over much of the norther hemisphere.  We can be pretty sure a lot of this carbon ends up on the Arctic ice cap, and as such contributes to an acceleration of melting.

I’v tried to do a thought experiment to think about what we would expect to see if this soot was driving a measurable percentage of Arctic ice melt.  It seems fairly certain that the soot would have limited effects during the season when new snow is falling.  Even a thin layer of new snow on top of deposited carbon would help mitigate its albedo-reducing effect.  So we would expect winter ice to look about like it has in the past, but summer ice, after the last snowfalls, to melt more rapidly in the past.  Once the seasons cool off again, when new ice is forming fresh without carbon deposits and snow again begins to fall, we would expect a catch-up effect where sea ice might increase very rapidly to return to winter norms.

Here is the Arctic ice chart from the last several years:

sea_ice1

Certainly consistent with our though experiment, but not proof by any means.  The last 2 years have shown very low summer ice conditions, but mostly normal/average winter extent.  One way we might get some insights into cause and effect is to look at temperatures.  If the last 2 years have had the lowest summer sea ice extents in 30 years, did they have the highest temperatures?

arctic_temp

Not really, but it may have been past warming has had a lag effect via ocean temperatures.

The point is that I am not opposed the idea that there can be anthropogenic effects on the climate, and it looks like black carbon deposits might have a real negative impact on sea ice.  If that were the case, this is really good news.  It is a LOT easier and cheaper to mitigate black carbon from combustion (something we have mostly but not completely done in the US) than it is to mitigate CO2  (which is a fundamental combustion product).