Deconstructing the Hockey Stick

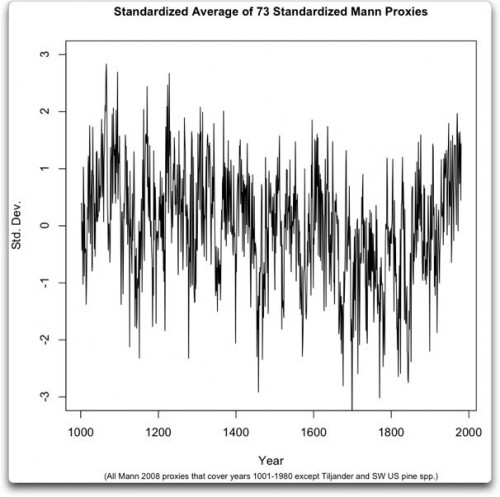
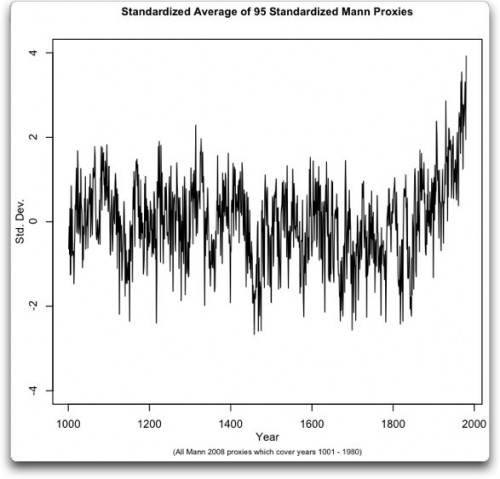
Will there ever be a time when sane people are not having to deconstruct yet another repackaging of Mann’s hockey stick, like some endless wack-a-mole game?  Mann is back with a new hockey stick and, blow me away with surprise, it looks a heck of a lot like the old hockey stick:

hs_1

Willis Eschenbach, writing at Climate Audit, outlines a new statistical approach he claims can help determine the signal-to-noise ratio in such a multi-proxy average, and in turn determine which proxies are contributing the most to the final outcome.

His approach and findings seem interesting, but I need to withhold judgment and let the statistical geeks tear it apart.  I am always suspicious of algorithms that purport to sort or screen samples in or out of a sample set.

However, his climate-related finding can be accepted without necessarily agreeing with the methodology that got there.  He claims his methodology shows that two sets of proxies — the Tiljander sediments and the Southwestern US Pines (mainly the bristlecones) — drive the hockey stick shape.  This is reminiscent of Steve McIntyre’s finding years ago that just a few proxies in the original MBH 1999 drove most of the hockey stick form.  Interestingly, these two series are the very ones that have received the most independent criticism for their methodology and ability to act as a proxy.  In particular, the Tiljander Lake sediment data is out and out corrupted, and it is incredible that they could get past a peer review process (just reinforcing my feeling that peer review passes shoddy work that reinforces the professions prejudices and stands in the way of quality work by mavericks challenging the consensus).

Anyway, with these proxies removed, less than a quarter of the total, the hockey stick disappears.

hs_2

Update: If you still have any confidence at all in climate scientists, I urge you to read this discussion of the Tiljander sediments.  Mann managed to make two enormous mistakes.  One, he used a series that the authors of the series very specifically caution has been disturbed and is not a valid proxy for the last 200-300 years.  And two, he inverts the whole series!  instead of showing it decreasing in the last 200 years  (again due to corruption the authors warned about) he shows it upside down, increasing in the last 200 years, which then helps him build his hockey stick on absolutely false data.

One might argue that this is just the indictment of one scientist, but everyone in the profession seems to rally around and defend this one scientist, and the flaws listed above have been public for a while and absolutely no one seems interested in demanding Mann correct his numbers.  In fact, most climate scientists spend their time shooting the messenger (Steve McIntyre).

Uh Oh. I Think I Am On NASA’s S-List

This screen shot was sent by a reader, who titled the email “you have hit the big time.”  I suppose I have, or at least I have really ticked off James Hansen and Gavin Schmidt at NASA.  It appears that this site has been added to the list of sites blocked by the NASA servers as ostensiblybeing sexually explicit.  Well, I guess we have caught the GISS with their pants down a few times….

nasa1

As usual, you may click on the image for the full-size version.  Thanks to a reader, who asked only that I hide his/her IP address.

Update: From the archives:

The top climate scientist at NASA says the Bush administration has tried to stop him from speaking out since he gave a lecture last month calling for prompt reductions in emissions of greenhouse gases linked to global warming.

The scientist, James E. Hansen, longtime director of the agency’s Goddard Institute for Space Studies, said in an interview that officials at NASA headquarters had ordered the public affairs staff to review his coming lectures, papers, postings on the Goddard Web site and requests for interviews from journalists.

Dr. Hansen said he would ignore the restrictions. “They feel their job is to be this censor of information going out to the public,” he said.

OK, I kindof mostly don’t think there is anything sinister here.  Coyote’s Law tells us that this is much more likely to be incompetence rather than evil intent.  But it would be interesting to see how Dr. Hansen would react if, say, the RealClimate site had been similarly filtered.  Anyone want to bet he would have thrown a conspiracy-laden hissy fit?

Update #2: Thanks for all those who pointed out that http://climate-skeptic.com was going to a park page with a bunch of ads.  That is fixed now.  Not sure if that was the cause or not.

Minor Site Redesign

I am doing a bit of site redesign as my CSS skills improve.  All of this is a prelude to my pending attempt to move this entire beast over to WordPress, a goal mainly thwarted right now by trying to preserve all the permalinks at the same addresses.

Anyway, I have a new page with all my published books and Powerpoint presentations here.  I have a page collecting all my videos here.   Since YouTube crunches all the videos to a resolution too small to really read my charts well, I have also set up a streaming video site with full resolution videos here.  All of these sites are easily reachable by the new menu bar across the top of the site.

Polar Amplification

Climate models generally say that surface warming on the Earth from greenhouse gasses should be greater at the poles than at the tropics.  This is called “polar amplification.”  I don’t now if the models originally said this, or if it was observed that the poles were warming more so it was thereafter built into the models, but that’s what they say now.  This amplification is due in part to how climate forcings around the globe interact with each other, and in part due to hypothesized positive feedback effects at the poles.  These feedback effects generally center around increases in ice melts and shrinking of sea ice extents, which causes less radiative energy to be reflected back into space and also provides less insulation of the cooler atmosphere from the warmer ocean.

In response to polar amplification, skeptics have often shot back that there seems to be a problem here, as while the North Pole is clearly warming, it can be argued the South Pole is cooling and has seen some record high sea ice extents at the exact same time the North Pole has hit record low sea ice extents.

Climate scientists now argue that by “polar amplification” they really only meant the North Pole.  The South Pole is different, say some scientists (and several comm enters on this blog) because the larger ocean extent in the Southern Hemisphere has always made it less susceptible ot temperature variations.  The latter is true enough, though I am not sure it is at all relevant to this issue.  In fact, per this data from the Cryosphere today, the seasonal change in sea ice area is larger in the Antarctic than the Arctic, which might argue that the south should see more sea ice extent.  Anyway, even the realclimate folks have never doubted it applied to the Antarctic, they just say it is slow to appear.

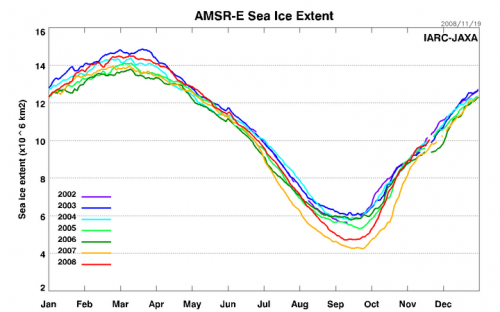
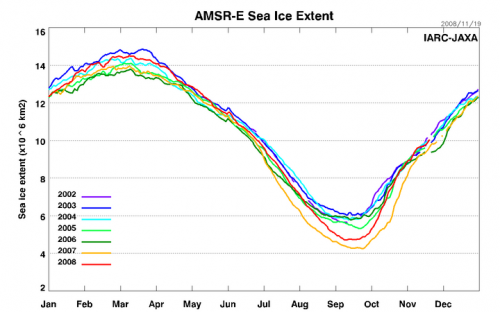
Anyway, I won’t go into the whole Antarctic thing more (except maybe in a postscript) but I do want to ask a question about Arctic amplification.  If the amplification comes in large part due to decreased albedo and more open ocean surface, doesn’t that mean most of the effect should be visible in summer and fall?  This would particularly be our expectation when we recognize that most of the recent anomaly in sea ice extent in the Arctic has been in summer.  I will repeat this chart just to remind you:

sea_ice

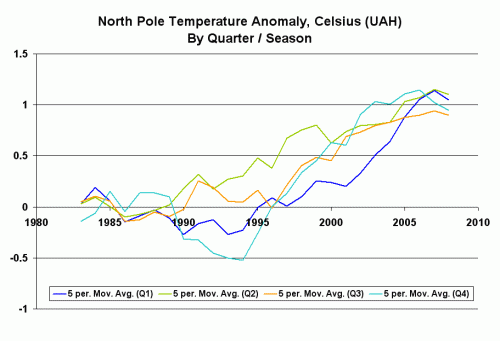
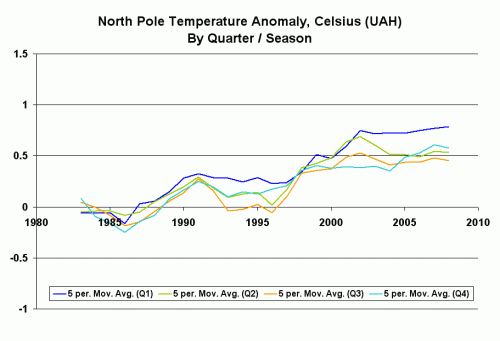
You can see that July-August-September are the biggest anomaly periods.  I took the UAH temperature data for the Arctic, and did something to it I had not seen before — I split it up into seasons.  Actually, I split it up into quarters, but these come within 8 days or so of matching the seasons.  Here is what I found (I used 5 year moving averages because the data is so volatile it was hard to eyeball a trend;  I also set each of the 4 seasonal anomalies individually to zero using the period 199-1989 as the base period)

seasons1

I see no seasonal trend here.  In fact, winter and spring have the highest anomalies vs. the base period, but the differences are so small currently as to be insignificant.  If polar amplification were occurring and the explanation for the North Pole warming more than the rest of the Earth (by far) over the last 30 years, shouldn’t I see it in the seasonal data.  I am honestly curious, and would like comments.

Postscript: Gavin Schmidt (who else) and Eric Steig have an old article in RealClimate if you want to read their Antarctic apologia.   It is kind of a funny article, if one asks himself “how many of the statements do they make discounting Antarctic cooling are identical to the ones skeptics use in reverse?  Here are a couple of gems:

It is important to recognize that the widely-cited “Antarctic cooling” appears, from the limited data available, to be restricted only to the last two decades

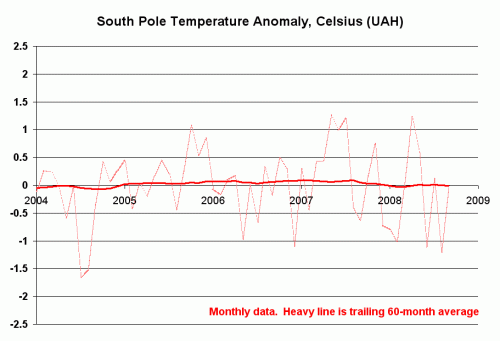
Given that this was written in 2004, he means restricted to 1984-2004.  Unlike global warming? By the way, he would see it for much longer than 20 years if these NASA scientists were not so hostile to space technologies (ie satellite measurement)

south_pole

It gets better.  They argue:

Additionally, there is some observational evidence that atmospheric dynamical changes may explain the recent cooling over parts of Antarctica. .

Thompson and Solomon (2002) showed that the Southern Annular Mode (a pattern of variability that affects the westerly winds around Antarctica) had been in a more positive phase (stronger winds) in recent years, and that this acts as a barrier, preventing warmer air from reaching the continent.

Interestingly, these same guys now completely ignore the same type finding when it is applied to North Pole warming.  Of course, this finding was made by a group entire hostile to folks like Schmidt at NASA. It comes from…. NASA

A new NASA-led study found a 23-percent loss in the extent of the Arctic’s thick, year-round sea ice cover during the past two winters. This drastic reduction of perennial winter sea ice is the primary cause of this summer’s fastest-ever sea ice retreat on record and subsequent smallest-ever extent of total Arctic coverage. …

Nghiem said the rapid decline in winter perennial ice the past two years was caused by unusual winds. “Unusual atmospheric conditions set up wind patterns that compressed the sea ice, loaded it into the Transpolar Drift Stream and then sped its flow out of the Arctic,” he said. When that sea ice reached lower latitudes, it rapidly melted in the warmer waters

I think I am going to put this into every presentation I give.  They say:

First, short term observations should be interpreted with caution: we need more data from the Antarctic, over longer time periods, to say with certainly what the long term trend is. Second, regional change is not the same as global mean change.

Couldn’t agree more.  Practice what you preach, though.  Y’all are the same guys raising a fuss over warming on the Antarctic Peninsula and the Lassen Ice Shelf, less than 2% of Antarctica which in turn is only a small part of the globe.

I will give them the last word, from 2004:

In short, we fully expect Antarctica to warm up in the future.

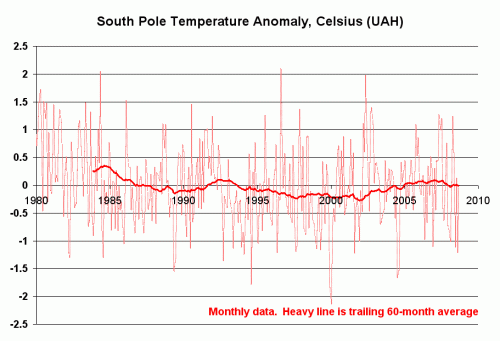
Of course, if they get the last word, I get the last chart (again from those dreaded satellites – wouldn’t life be so much better at NASA without satellites?)

south_pole2

Update:  I ran the same seaonal analysis for may different areas of the world.  The one area I got a strong seasonal difference that made sense was for the Northern land areas above the tropics.

seasons2

This is roughly what one would predict from CO2 global warming (or other natural forcings, by the way).  The most warming is in the winter, when reduced snow cover area reduces albedo and so provides positive feedback, and when cold, dry night air is thought to be more sensitive to such forcings.

For those confused — the ocean sea ice anomaly is mainly in the summer, the land snow/ice extent anomaly will appear mostly in the winter.

Black Carbon and Arctic Ice

My company runs a snow play area north of Flagstaff, Arizona.  One of the problems with this location is that the main sledding runs are on a black cinder hill.  Covered in snow, this is irrelevant.  But once the smallest hole opens up to reveal the black cinders underneath, the hole opens and spreads like crazy.  The low albedo cinders absorb heat much faster than reflective white snow, and then spread that heat into the snow and melts it.

Anthony Watt does an experiment with ash and snow in his backyard, and the effects are dramatic.

Even tiny amounts of soot pollution can induce high amounts of melting. There is little or no ash at upper right.. Small amounts of ash in the lower and left areas of the photo cause significant melting at the two-hour mark in the demonstration.

I won’t steal his thunder by taking his pictures, but you should look at them — as the saying goes, they are worth a thousand words.

We know that Chinese coal plants pump out a lot of black carbon soot that travels around the world and deposits itself over much of the norther hemisphere.  We can be pretty sure a lot of this carbon ends up on the Arctic ice cap, and as such contributes to an acceleration of melting.

I’v tried to do a thought experiment to think about what we would expect to see if this soot was driving a measurable percentage of Arctic ice melt.  It seems fairly certain that the soot would have limited effects during the season when new snow is falling.  Even a thin layer of new snow on top of deposited carbon would help mitigate its albedo-reducing effect.  So we would expect winter ice to look about like it has in the past, but summer ice, after the last snowfalls, to melt more rapidly in the past.  Once the seasons cool off again, when new ice is forming fresh without carbon deposits and snow again begins to fall, we would expect a catch-up effect where sea ice might increase very rapidly to return to winter norms.

Here is the Arctic ice chart from the last several years:

sea_ice1

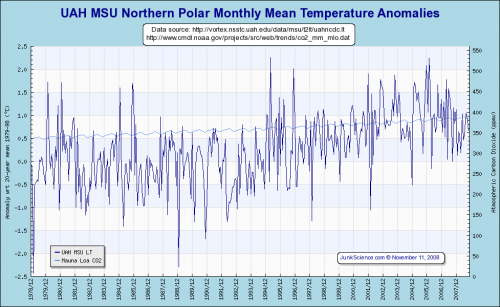
Certainly consistent with our though experiment, but not proof by any means.  The last 2 years have shown very low summer ice conditions, but mostly normal/average winter extent.  One way we might get some insights into cause and effect is to look at temperatures.  If the last 2 years have had the lowest summer sea ice extents in 30 years, did they have the highest temperatures?

arctic_temp

Not really, but it may have been past warming has had a lag effect via ocean temperatures.

The point is that I am not opposed the idea that there can be anthropogenic effects on the climate, and it looks like black carbon deposits might have a real negative impact on sea ice.  If that were the case, this is really good news.  It is a LOT easier and cheaper to mitigate black carbon from combustion (something we have mostly but not completely done in the US) than it is to mitigate CO2  (which is a fundamental combustion product).

Don’t Count Those Skeptics Out

From Mark Scousen in "Making Modern Economics"

Ironically, by the time of the thirteenth edition [of Paul Samuelsons popular economics textbook], right before the Berlin Wall was torn down, Samuleson and Nordhaus confidently declared, "The Soviet economy is proof that, contrary to what many skeptics believed [a reference to Mises and Hayek], a socialist command economy can function and even thrive."  From this online excerpt.


Your One-Stop Climate Panic Resource

Absolutely classic video — a must see:

From Marc Marano via Tom Nelson:

This 9 ½ minute video brilliantly and accurately (it is not a spoof!) shows the absurdity of today’s man-made global warming fear campaign. It appears to have been produced by a group called Conservative Cavalry. They really did their homework and put together quite a show. This video should be shown in classrooms across the country and in newsrooms!

The video is based on the website “A complete list of things caused by global warming.”

The website is run by Dr. John Brignell is a UK Emeritus Engineering Professor at the University of Southampton who held the Chair in Industrial Instrumentation at Southampton.

This Just In, From Climate Expert Barrack Obama

Via Tom Nelson:

“Few challenges facing America — and the world – are more urgent than combating climate change,” he says in the video. “The science is beyond dispute and the facts are clear. Sea levels are rising. Coastlines are shrinking. We’ve seen record drought, spreading famine, and storms that are growing stronger with each passing hurricane season. Climate change and our dependence on foreign oil, if left unaddressed, will continue to weaken our economy and threaten our national security.

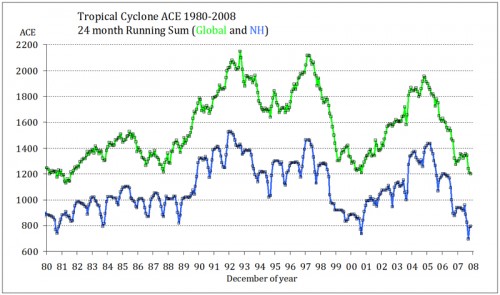
From Ryan Maue of FSU comes accumulated cyclonic energy, the best single metric of the strength of hurricane seasons:

cyclone_energy

Coming soon, Obama tells that story about this guy he knows who swears his grandmother tried to dry her cat by putting it in the microwave.

NOAA Adjustments

Anthony Watts has an interesting blink comparisonbetween the current version of history from the GISS and their version of history in 1999.  It is amazing that all of the manual adjustments they add to the raw data constantly have the effect of increasing historical warming.  By continuing to adjust recent temperatures up, and older temperatures down, they are implying that current measurement points have a cooling bias vs. several decades ago.  REALLY?  This makes absolutely no sense given what we now know via Anthony Watt’s efforts to document station installation details at surfacestations.org.

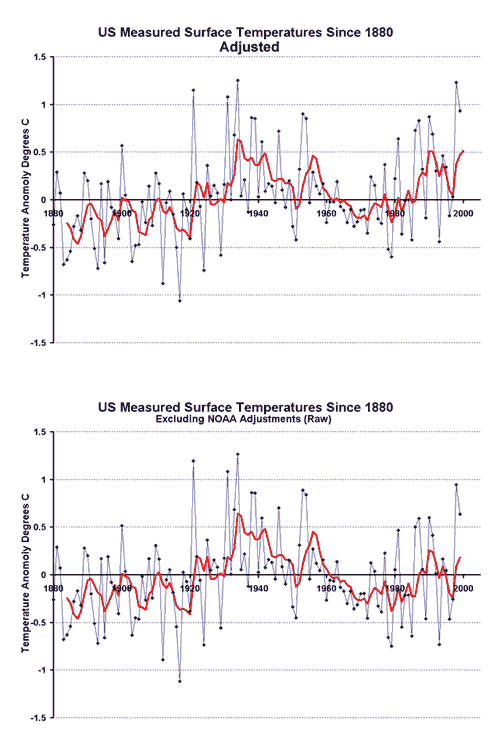
I created a blink comparison a while back that was related but slightly different.  I created a blink comparison to show the effect of NOAA manual adjustments to the raw temperature data.

adjustments

My point was not that all these adjustments were unnecessary (the time of observation adjustment is required, though I have always felt it to be exaggerated).  But all of the adjustments are upwards, even those for station quality.  The net effect is that there is no global warming signal in the US, at least in the raw data.  The global warming signal emerges entirely from the manual adjustments.  Which causes one to wonder as to the signal to noise ratio here.  And increases the urgency to get more scrutiny on these adjustments.

It only goes through 2000, because I only had the adjustment numbers through 2000.  I will see if I can update this.

On Quality Control of Critical Data Sets

A few weeks ago, Gavin Schmidt of NASAcame out with a fairly petulant response to critics who found an error in NASA's GISS temperature database.  Most of us spent little time criticizing this particular error, but instead criticized Schmidts unhealthy distaste for criticism and the general sloppiness and lack of transparency in the NOAA and GISS temperature adjustment and averaging process.

I don't want to re-plow old ground, but I can't resist highlighting one irony.  Here is Gavin Schmidt in his recent post on RealClimate:

It is clear that many of the temperature watchers are doing so in order to show that the IPCC-class models are wrong in their projections. However, the direct approach of downloading those models, running them and looking for flaws is clearly either too onerous or too boring.

He is criticizing skeptics for not digging into the code of the individual climate models, and focusing only on how their output forecasts hold out (a silly criticism I dealt with here).  But this is EXACTLY what folks like Steve McIntyre have been trying to do for years with the NOAA, GHCN, and GISS temperature metric code.  Finding nothing about the output that makes sense given the raw data, they have asked to examine the source code.  And they have met with resistance at every turn by, among others, Gavin Schmidt.  As an example, here is what Steve gets typically when he tries to do exactly as Schmidt asks:

I'd also like to report that over a year ago, I wrote to GHCN asking for a copy of their adjustment code:

I’m interested in experimenting with your Station History Adjustment algorithm and would like to ensure that I can replicate an actual case before thinking about the interesting statistical issues.  Methodological descriptions in academic articles are usually very time-consuming to try to replicate, if indeed they can be replicated at all. Usually it’s a lot faster to look at source code in order to clarify the many little decisions that need to be made in this sort of enterprise. In econometrics, it’s standard practice to archive code at the time of publication of an article – a practice that I’ve (by and large unsuccessfully) tried to encourage in climate science, but which may interest you. Would it be possible to send me the code for the existing and the forthcoming Station History adjustments. I’m interested in both USHCN and GHCN if possible.

To which I received the following reply from a GHCN employee:

You make an interesting point about archiving code, and you might be encouraged to hear that Configuration Management is an increasingly high priority here. Regarding your request — I'm not in a position to distribute any of the code because I have not personally written any homogeneity adjustment software. I also don't know if there are any "rules" about distributing code, simply because it's never come up with me before.

I never did receive any code from them.

Here, by the way, is a statement from the NOAA web site about the GHCN data:

Both historical and near-real-time GHCN data undergo rigorous quality assurance reviews. These reviews include preprocessing checks on source data, time series checks that identify spurious changes in the mean and variance, spatial comparisons that verify the accuracy of the climatological mean and the seasonal cycle, and neighbor checks that identify outliers from both a serial and a spatial perspective.

But we will never know, because they will not share the code developed at taxpayer expense by government employees to produce official data.

A year or so ago, after intense pressure and the revelation of another mistake (again by the McIntyre/Watt online communities) the GISS did finally release some of their code.  Here is what was found:

Here are some more notes and scripts in which I've made considerable progress on GISS Step 2. As noted on many occasions, the code is a demented mess – you'd never know that NASA actually has software policies (e.g. here or here. I guess that Hansen and associates regard themselves as being above the law. At this point, I haven't even begum to approach analysis of whether the code accomplishes its underlying objective. There are innumerable decoding issues – John Goetz, an experienced programmer, compared it to descending into the hell described in a Stephen King novel. I compared it to the meaningless toy in the PPM children's song – it goes zip when it moves, bop when it stops and whirr when it's standing still. The endless machinations with binary files may have been necessary with Commodore 64s, but are totally pointless in 2008.

Because of the hapless programming, it takes a long time and considerable patience to figure out what happens when you press any particular button. The frustrating thing is that none of the operations are particularly complicated.

So Schmidt's encouragement that skeptics should go dig into the code was a) obviously not meant to be applied to hiscode and b) roughly equivalent to a mom answering her kids complaint that they were bored and had nothing to do with "you can clean your rooms" — something that looks good in the paper trail but is not really meant to be taken seriously.  As I said before:

I am sure Schmidt would love us all to go off on some wild goose chase in the innards of a few climate models and relent on comparing the output of those models against actual temperatures.

Responses to Gavin Schmidt, Part 2

OK, we continue to the final paragraph of Gavin Schmidt’s postadmitting a minor error in the October GISS numbers, and then proceeding to say that all the folks who pointed out the error are biased and unhelpful, in spite of the fact (or maybe because of the fact) that they found this error.

As I reviewed in part 1, most of the letter was just sort of petulant bad grace.  But this paragraph was worrisome, and I want to deal with it in more depth:

Which brings me to my last point, the role of models. It is clear that many of the temperature watchers are doing so in order to show that the IPCC-class models are wrong in their projections. However, the direct approach of downloading those models, running them and looking for flaws is clearly either too onerous or too boring. Even downloading the output (from here or here) is eschewed in favour of firing off Freedom of Information Act requests for data already publicly available – very odd. For another example, despite a few comments about the lack of sufficient comments in the GISS ModelE code (a complaint I also often make), I am unaware of anyone actually independently finding any errors in the publicly available Feb 2004 version (and I know there are a few). Instead, the anti-model crowd focuses on the minor issues that crop up every now and again in real-time data processing hoping that, by proxy, they’ll find a problem with the models.

I say good luck to them. They’ll need it.

Since when has direct comparison of forecast models against observation and measurement been the wrong way to validate or invalidate the forecast or model? I am sure there were lots of guys who went through the Principia Mathematica and tore apart the math and equations to make sure they balanced, but most of the validation consisted of making observations of celestial bodies to see if their motion fit the predicted results.  When Einstein said time would change pace in a gravity well, scientists took atomic clocks up in high-altitude airplanes to see if his predictions matched measured results.  And physicists can play with models and equations all day, but nothing they do with the math will be as powerful as finding a Higgs Boson at the LHC.

Look, unlike some of the commenters Schmidt quoted, there is no reason to distrust a guy because his staff made a data error.  But I think there is a big freaking reason to distrust someone who gets huffy that people are using actual data measurements to test his prediction models.

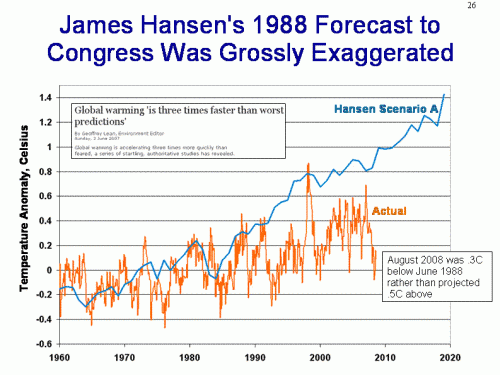
There is probably a reason for Schmidt to be sensitive here.  We know that Hansen’s 1988 forecasts don’t validate at all against actual data from the last 20 years (below uses the Hansen A case from his Congressional testimony, the case which most closely matches actual CO2 production since the speech).

gavin_forecast

More recent forecasts obviously have had less time to validate.  Many outsiders have found that current temperatures fall outside of the predicted range of the IPCC forecasts, and those that have found temperatures within the error bars of the forecasts have generally done so by combining large error bars, white noise, and various smoothing approaches to just eek actual temperatures into the outer molecular layers of the bottom edge of the forecast band.

As to the rest, I am not sure Schmidt knows who has and has not poked around in the innards of the models – has he studied all the referrer logs for their web sites?  But to some extent this is beside the point.  Those of us who have a lot of modeling experience in complex systems (my experience is in both econometrics and in mechanical control systems) distrust models and would not get any warm fuzzies from poking around in their innards.  Every modeler of chaotic systems knows that it is perfectly possible to string together all sorts of logically sound and reasonable assumptions and algorithms only to find that the whole mass of them combined spits out a meaningless mess.  Besides, there are, what, 60 of these things?  More?  I could spend 6 months ripping the guts out of one of them only to have Schmidt then say, well there are 59 others.  That one does not really affect anything.  I mean, can’t you just see it — it would be entirely equivalent to the reaction every time an error or problem measurement station is found in the GISS data set.  I am sure Schmidt would love us all to go off on some wild goose chase in the innards of a few climate models and relent on comparing the output of those models against actual temperatures.

No, I am perfectly happy to accept the IPCC’s summary of these models and test this unified prediction against history.  I am sure that no matter what temperature it is this month, some model somewhere in the world came close.  But how does that help, unless it turns out that it is the same model that is right month after month, and then I might get excited someone was on to something.  But just saying current temperatures fall into a range where some model predicts it just says that there is a lot of disagreement among the models, and in turn raises my doubts about the models.

The last sentence of Schmidt’s paragraph is just plain wrong.  I have never seen anyone who is out there really digging into this stuff (and not just tossing in comments) who has said that errors in the GISS temperature anomaly number imply the models are wrong, except of course to the extent that the models are calibrated to an incorrect number.  Most everyone who looks at this stuff skeptically understand that the issues with the GISS temperature metric are very different than issues with the models.

In a nutshell, skeptics are concerned with the GISS temperature numbers because of the signal to noise problem, and a skepticism that the GISS has really hit on algorithms that can, blind to station configuration, correct for biases and errors in the data.  I have always felt that rather than eliminate biases, the gridcell approach simply spreads them around like peanut butter.

My concern with the climate models is completely different.  I won’t go into them all, but they include:

  • the inherent impossibility of modeling such a chaotic system
  • scientists assume CO2 drives temperatures, so the models they build unsurprisingly result in CO2 driving temperature
  • modelers assume WAY too much positive feedback.  No reasonable person, if they step back from it, should really be able to assume so much positive feedback in a long-term stable system
  • When projected backwards, modeler’s assumptions imply far more warming than we have experienced, and it takes heroic assumptions and tweaks and plugs to make the models back-cast reasonably well.
  • Its insane to ignore changes in solar output, and/or to assume that the sun over the last 40 years has been in a declining cycle
  • Many models, by their own admission, omit critical natural cycles like ENSO/PDO.

By the way, my simple hypothesis to describe past and future warming is here.

As a final note, the last little dig on Steve McIntyre (the bit about FOIA requests) is really low.  First, it is amazing to me that, like Hogwarts students who can’t say the word Voldemort, the GISS folks just can’t bring themselves to mention his name.  Second, Steve has indeed filed a number of FOIA requests on Michael Mann, the GISS, and others.  Each time he has a pretty good paper trail of folks denying him data (Here is the most recent for the Santer data). Almost every time, the data he is denied is taxpayer funded research, often by public employees, or is data that the publication rules of a particular journal require to be made public.  And remember the source for this — this is coming from the GISS, which resisted McIntyre’s calls for years to release their code  (publicly funded code of a government organization programmed by government employees to produce an official US statistic) for the GISS grid cell rollup of the station data, releasing the code only last year after McIntyre demonstrated an error in the code based on inspection of the inputs and outputs.

At the end of the day, Hansen and Schmidt are public employees who like having access to government budgets and the instant credibility the NASA letterhead provides them, but don’t like the public scrutiny that goes with it.  Suck it up guys.  And as to your quest to rid yourself of these skeptic gadflies, I will quote your condescending words back to you:  Good Luck.  You’ll need it.

Sorry Dr. Schmidt, But I am Not Feeling Guilty Yet (Part 1)

By accident, I have been drawn into a discussion surrounding a fairly innocent mistake made by NASA’s GISS in their October global temperature numbers.  It began for me when I compared the October GISS and UAH satellite numbers for October, and saw an incredible diversion.  For years these two data sets have shown a growing gap, but by tiny increments.  But in October they really went in opposite directions.  I used this occasion to call on the climate community to make a legitimate effort at validating and reconciling the GISS and satellite data sets.

Within a day of my making this post, several folks started noticing some oddities in the GISS October data, and eventually the hypothesis emerged that the high number was the result of reusing September numbers for certain locations in the October data set. Oh, OK.  A fairly innocent and probably understandable mistake, and far more minor than the more systematic error a similar group of skeptics, (particularly Steve McIntyre, the man whose name the GISS cannot speak) found in the GISS data set a while back.  The only amazing thing to me was not the mistake, but the fact that there were laymen out there on their own time who figured out the error so quickly after the data release.  I wish there were a team of folks following me around, fixing material errors in my analysis before I ran too far with it.

So Gavin Schmidt of NASA comes out a day or two later and says, yep, they screwed up.  End of story, right?  Except Dr. Schmidt chose his blog post about the error to lash out at skeptics.  This is so utterly human — in the light of day, most will admit it is a bad idea to lash out at your detractors in the same instant you admit they caught you in an error (however minor).  But it is such a human need to try to recover and sooth one’s own ego at exactly this same time.  And thus we get Gavin Schmidt’s post on RealClimate.com, which I would like to highlight a bit below.

He begins with a couple of paragraphs on the error itself.  I will skip these, but you are welcome to check them out at the original.  Nothing about the error seems in any way outside the category of “mistakes happen.”  Had the post ended with something like “Many thanks to the volunteers who so quickly helped us find this problem,” I would not even be posting.  But, as you can guess, this is not how it ends.

It’s clearly true that the more eyes there are looking, the faster errors get noticed and fixed. The cottage industry that has sprung up to examine the daily sea ice numbers or the monthly analyses of surface and satellite temperatures, has certainly increased the number of eyes and that is generally for the good. Whether it’s a discovery of an odd shiftin the annual cycle in the UAH MSU-LT data, or this flub in the GHCN data, or the USHCN/GHCN merge issue last year, the extra attention has led to improvements in many products. Nothing of any consequence has changed in terms of our understanding of climate change, but a few more i’s have been dotted and t’s crossed.

Uh, OK, but it is a bit unfair to characterize the “cottage industry” looking over Hansen’s and Schmidt’s shoulders as only working out at the third decimal place.  Skeptics have pointed out what they consider to be fundamental issues in some of their analytical approaches, including their methods for compensating statistically for biases and discontinuities in measurement data the GISS rolls up into a global temperature anomaly.  A fairly large body of amateur and professional work exists questioning the NOAA and GISS methodologies which often result in manual adjustments to the raw data larger in magnitude than the underlying warming signal tyring to be measured.  I personally think there is a good case to be made that the GISS approach is not sufficient to handle this low signal to noise data, and that the GISS has descended in to “see no evil, hear no evil” mode in ignoring the station survey approach being led by Anthony Watt.  Just because Schmidt does not agree doesn’t mean that the cause of climate science is not being advanced.

The bottom line, as I pointed out in my original post, is that the GISS anomaly and the satellite-measured anomaly are steadily diverging.  Given some of the inherent biases and problems of surface temperature measurement, and NASA’s commitment to space technology as well as its traditional GISS metric, its amazing to me that Schmidt and Hansen are effectively punting instead of doing any serious work to reconcile the two metrics.  So it is not surprising that into this vacuum left by Schmidt rush others, including us lowly amateurs.
By the way, this is the second time in about a year when the GISS has admitted an error in their data set, but petulently refused to mention the name of the person who helped them find it.

But unlike in other fields of citizen-science (astronomy or phenology spring to mind), the motivation for the temperature observers is heavily weighted towards wanting to find something wrong. As we discussed last year, there is a strong yearning among some to want to wake up tomorrow and find that the globe hasn’t been warming, that the sea ice hasn’t melted, that the glaciers have not receded and that indeed, CO2is not a greenhouse gas. Thus when mistakes occur (and with science being a human endeavour, they always will) the exuberance of the response can be breathtaking – and quite telling.

I am going to make an admission here that Dr. Schmidt very clear thinks is evil:  Yes, I want to wake up tomorrow to proof that the climate is not changing catastrophically.  I desperately hope Schmidt is overestimating future anthropogenic global warming.  Here is something to consider.  Take two different positions:

  1. I hope global warming theory is correct and the world faces stark tradeoffs between environmental devastation and continued economic growth and modern prosperity
  2. I hope global warming theory is over-stated and that these tradeoffs are not as stark.

Which is more moral?  Why do I have to apologize for being in camp #2?  Why isn’t it equally “telling” that Dr. Schmidt apparently puts himself in camp #1.

Of course, we skeptics would say the same of Schmidt.  As much as we like to find a cooler number, we believe he wants to find a warmer number.  Right or wrong, most of us see a pattern in the fact that the GISS seems to constantly find ways to adjust the numbers to show a larger historic warming, but require a nudge from outsiders to recognize when their numbers are too high.  The fairest way to put it is that one group expects to see lower numbers and so tends to put more scrutiny on the high numbers, and the other does the opposite.

Really, I don’t think that Dr. Schmidt is a very good student of the history of science when he argues that this is somehow unique to or an aberration in modern climate science.  Science has often depended on rivalries to ensure that skepticism is applied to both positive and negative results of any experiment.  From phlogistan to plate techtonics, from evolution to string theory, there is really nothing new in the dynamic he describes.

A few examples from the comments at Watt’s blog will suffice to give you a flavour of the conspiratorial thinking: “I believe they had two sets of data: One would be released if Republicans won, and another if Democrats won.”, “could this be a sneaky way to set up the BO presidency with an urgent need to regulate CO2?”, “There are a great many of us who will under no circumstance allow the oppression of government rule to pervade over our freedom—-PERIOD!!!!!!” (exclamation marks reduced enormously), “these people are blinded by their own bias”, “this sort of scientific fraud”, “Climate science on the warmer side has degenerated to competitive lying”, etc… (To be fair, there were people who made sensible comments as well).

Dr. Schmidt, I am a pretty smart person.  I have lots of little diplomas on my wall with technical degrees from Ivy League universities.  And you know what – I am sometimes blinded by my own biases.  I consider myself a better thinker, a better scientist, and a better decision-maker because I recognize that fact.  The only person who I would worry about being biased is the one who swears that he is not.

By the way, I thought the little game of mining the comments section of Internet blogs to discredit the proprietor went out of vogue years ago, or at least has been relegated to the more extreme political  blogs like Kos or LGF.  Do you really think I could not spend about 12 seconds poking around environmentally-oriented web sites and find stuff just as unfair, extreme, or poorly thought out?

The amount of simply made up stuff is also impressive – the GISS press release declaring the October the ‘warmest ever’? Imaginary (GISS only puts out press releases on the temperature analysis at the end of the year). The headlines trumpeting this result? Non-existent. One clearly sees the relief that finally the grand conspiracy has been rumbled, that the mainstream media will get it’s comeuppance, and that surely now, the powers that be will listen to those voices that had been crying in the wilderness.

I am not quite sure what he is referring to here.  I will repeat what I wrote.  I said “The media generally uses the GISS data, so expect stories in the next day or so trumpeting ‘Hottest October Ever.'”  I leave it to readers to decide if they find my supposition unwarranted.  However, I encourage the reader to consider the 556,000 Google results, many media stories, that come up in a search for the words “hottest month ever.”  Also, while the GISS may not issue monthly press releases for this type of thing, the NOAA and British Met Office clearly do, and James Hansen has made many verbal statements of this sort in the past.

By the way, keep in mind that that Dr. Schmidt likes to play Clinton-like games with words.  I recall one episode last year when he said that climate models did not use the temperature station data, so they cannot be tainted with any biases found in the stations.  Literally true, I guess, because the the models use gridded cell data.  However, this gridded cell data is built up, using a series of correction and smoothing algorithms that many find suspect, from the station data.  Keep this in mind when parsing Dr. Schmidt.

Alas! none of this will come to pass. In this case, someone’s programming error will be fixed and nothing will change except for the reporting of a single month’s anomaly. No heads will roll, no congressional investigations will be launched, no politicians (with one possible exception) will take note. This will undoubtedly be disappointing to many, but they should comfort themselves with the thought that the chances of this error happening again has now been diminished. Which is good, right?

I’m narrowly fine with the outcome.  Certainly no heads should roll over a minor data error.  I’m not certain no one like Watt or McIntyre suggested such a thing.  However, the GISS should be embarrassed that they have not addressed and been more open about the issues in their grid cell correction/smoothing algorithms, and really owe us an explanation why no one there is even trying to reconcile the growing differences with satellite data.

In contrast to this molehill, there is an excellent story about how the scientific community really deals with serious mismatches between theory, models and data. That piece concerns the ‘ocean cooling’ story that was all the rage a year or two ago. An initial analysisof a new data source (the Argo float network) had revealed a dramatic short term cooling of the oceans over only 3 years. The problem was that this didn’t match the sea level data, nor theoretical expectations. Nonetheless, the paper was published (somewhat undermining claims that the peer-review system is irretrievably biased) to great acclaim in sections of the blogosphere, and to more muted puzzlement elsewhere. With the community’s attention focused on this issue, it wasn’t however long before problemsturned up in the Argo floats themselves, but also in some of the other measurement devices – particularly XBTs. It took a couple of years for these things to fully work themselves out, but the most recent analysesshow far fewer of the artifacts that had plagued the ocean heat content analyses in the past. A classic example in fact, of science moving forward on the back of apparent mismatches. Unfortunately, the resolution ended up favoring the models over the initial data reports, and so the whole story is horribly disappointing to some.

OK, fine, I have no problem with this.  However, and I am sure that Schmidt would deny this to his grave, but he is FAR more supportive of open inspection of measurement sources that disagree with his hypothesis (e.g. Argo, UAH) than he is willing to tolerate scrutiny of his methods.  Heck, until last year, he wouldn’t even release most of his algorithms and code for his grid cell analysis that goes into the GISS metric, despite the fact he is a government employee and the work is paid for with public funds.  If he is so confident, I would love to see him throw open the whole GISS measurement process to an outside audit.  We would ask the UAH and RSS guys to do the same.  Here is my prediction, and if I am wrong I will apologize to Dr. Schmidt, but I am almost positive that while the UAH folks would say yes, the GISS would say no.  The result, as he says, would likely be telling.

Which brings me to my last point, the role of models. It is clear that many of the temperature watchers are doing so in order to show that the IPCC-class models are wrong in their projections. However, the direct approach of downloading those models, running them and looking for flaws is clearly either too onerous or too boring. Even downloading the output (from here or here) is eschewed in favour of firing off Freedom of Information Act requests for data already publicly available – very odd. For another example, despite a few comments about the lack of sufficient comments in the GISS ModelE code (a complaint I also often make), I am unaware of anyone actually independently finding any errors in the publicly available Feb 2004 version (and I know there are a few). Instead, the anti-model crowd focuses on the minor issues that crop up every now and again in real-time data processing hoping that, by proxy, they’ll find a problem with the models.

I say good luck to them. They’ll need it.

Red Alert!  Red Alert!  Up to this point, the article was just petulant and bombastic.  But here, Schmidt becomes outright dangerous, suggesting a scientific process that is utterly without merit.  But I want to take some time on this, so I will pull this out into a second post I will label part 2.

This is Getting Absurd

Update: The gross divergence in October data reported below between the various metrics is explained by an error, as reported at the bottom.  The basic premise of the post, that real scientific work should go into challenging these measurement approaches and choosing the best data set, remains.

The October global temperature data highlights for me that it is time for scientists to quit wasting time screwing around with questions of whether global warming will cause more kidney stones, and address an absolutely fundamental question:  Just what is the freaking temperature?

Currently we are approaching the prospect of spending hundreds of billions of dollars, or more, to combat global warming, and we don’t even know its magnitude or real trend, because the major temperature indices we possess are giving very different readings.  To oversimplify a bit, there are two competing methodologies that are giving two different answers.  NASA’s GISS uses a melding of surface thermometer readings around the world to create a global temperature anomaly.  And the UAH uses satellites to measure temperatures of the lower or near-surface troposhere.  Each thinks it has the better methodology  (with, oddly, NASA fighting against the space technology).  But they are giving us different answers.

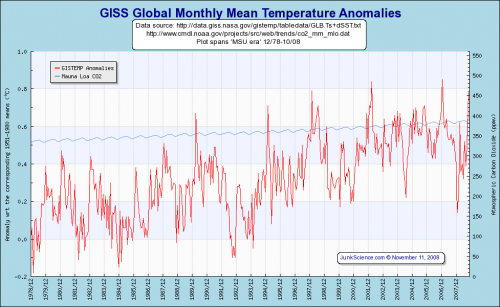
For October, the GISS metric is showing the hottest October on record, nearly 0.8C hotter than it was 40 years ago in 1978 (from here).

giss_global

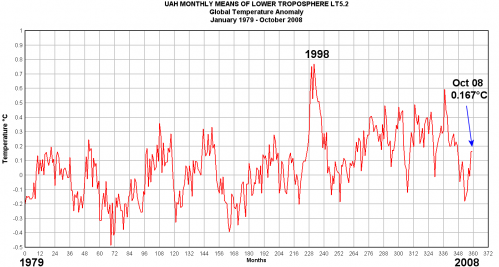
However, the satellites are showing no such thing, showing a much cooler October, and a far smaller warming trend over the last 40 years (from here)

uah_global

So which is right?  Well, the situation is not helped by the fact that the GISS metric is run by James Hansen, considered by skeptics to be a leading alarmist, and the UAH is run by John Christy, considered by alarmists to be an arch-skeptic.  The media generally uses the GISS data, so expect stories in the next day or so trumpeting “Hottest October Ever,” which the Obama administration will wave around as justification for massive economic interventions.  But by satellite it will only be the 10th or so hottest in the last 30, and probably cooler than most other readings this century.

It is really a very frustrating situation.  It is as if two groups in the 17th century had two very different sets of observations of planetary motions that resulted in two different theories of gravity,

Its amazing to me the scientific community doesn’t try to take this on.  If the NOAA wanted to do something useful other than just creating disaster pr0n, it could actually have a conference on the topic and even some critical reviews of each approach.  Why not have Christy and Hansen take turns in front of the group and defend their approaches like a doctoral thesis?  Nothing can replace surface temperature measurement before 1978, because we do not have satellite data before then.  But even so, discussion of earlier periods is important given issues with NOAA and GISS manual adjustments to the data.

Though I favor the UAH satellite data (and prefer a UAH – Hadley CRUT3 splice for a longer time history), I’ll try to present as neutrally as possible the pros and cons of each approach.

GISS Surface Temperature Record

+  Measures actual surface temperatures

+  Uses technologies that are time-tested and generally well-understood

+  Can provide a 100+ year history

– Subject to surface biases, including urban heat bias.  Arguments rage as to the size and correctability of these biases

– Coverage can range from dense to extremely spotty, with as little as 20KM and as much as 1000KM between measurement sites

– Changing technologies and techniques, both at sea and on land, have introduced step-change biases

– Diversity of locations, management, and technology makes it hard to correct for individual biases

– Manual adjustments to the data to correct errors and biases are often as large or larger than the magnitude of the signal (ie global warming) trying to be measured.  Further, this adjustment process has historically been shrouded in secrecy and not subject to much peer review

– Most daily averages based on average of high and low temperature, not actual integrated average

UAH Satellite Temperature Record

+  Not subject to surface biases or location biases

+  Good global coverage

+  Single technology and measurement point such that discovered biases or errors are easier to correct

–  Only 40 years of history

–  Still building confidence in the technology

–  Coverage of individual locations not continuous – dependent on satellite passes.

–  Not measuring the actual surface temperature, but the lower troposphere (debate continues as to whether these are effectively the same).

–  Single point of failure – system not robust to the failure of a single instrument.

–  I am not sure how much the UAH algorithms have been reviewed and tested by outsiders.

Update: Well, this is interesting.  Apparently the reason October was so different between the two metrics was because one of the two sources made a mistake that substantially altered reported temperatures.  And the loser is … the GISS, which apparently used the wrong Russian data for October, artificially inflating temperatures.  So long “hottest October ever,” though don’t hold your breath for the front-page media retraction.