Let me digress a bit. Just over 500 years ago, Aristotelian physics and mechanical models still dominated science. The odd part about this was not that people were still using his theories nearly 2000 years after his death — after all, won’t people still know Isaac Newton’s contributions a thousand years hence? The strange part was that people had been observing natural effects for centuries that were entirely inconsistent with Aristotle’s mechanics, but no one really questioned the underlying theory.
But folks found it really hard to question Aristotle. The world had gone all-in on Aristotle. Even the Church had adopted Aristotle’s description of the universe as the one true and correct model. So folks assumed the observations were wrong, or spent their time shoe-horning the observations into Aristotle’s theories, or just ignored the offending observations altogether. The Enlightenment is a complex phenomenon, but for me the key first step was the willingness of people to start questioning traditional authorities (Aristotle and the church) in the light of new observations.
I am reminded of this story a bit when I read about “fingerprint” analyses for anthropogenic warming. These analyses propose to identify certain events in current climate (or weather) that are somehow distinctive features of anthropogenic rather than natural warming. From the GCCI:
The earliest fingerprint work focused on changes in surface and atmospheric temperature. Scientists then applied fingerprint methods to a whole range of climate variables, identifying human-caused climate signals in the heat content of the oceans, the height of the tropopause (the boundary between the troposphere and stratosphere, which has shifted upward by hundreds of feet in recent decades), the geographical patterns of precipitation, drought, surface pressure, and the runoff from major river basins.
Studies published after the appearance of the IPCC Fourth Assessment Report in 2007 have also found human fingerprints in the increased levels of atmospheric moisture (both close to the surface and over the full extent of the atmosphere), in the decline of Arctic sea ice extent, and in the patterns of changes in Arctic and Antarctic surface temperatures.
This is absolute caca. Given the complexity of the climate system, it is outright hubris to say that things like the “geographical patterns of precipitation” can be linked to half-degree changes in world average temperatures. But it is a lie to say that it can be linked specifically to human-caused warming, vs. warming from other causes, as implied in this statement. A better name for fingerprint analysis would be Rorschach analysis, because they tend to result in alarmist scientists reading their expectation to find anthropogenic causes into every single weather event.
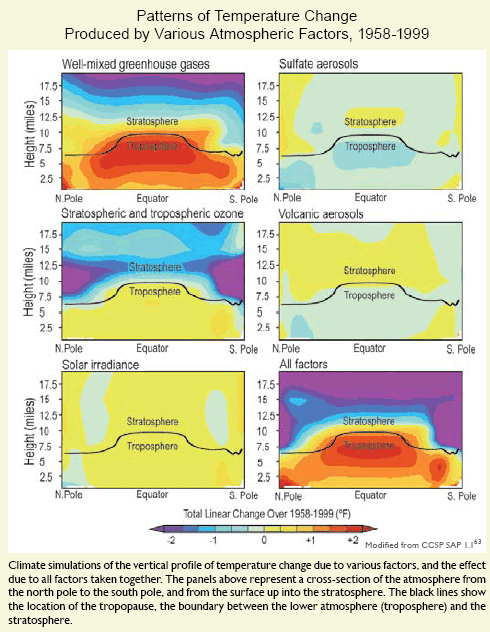
But there is one fingerprint prediction that was among the first to be made and is still probably the most robust of this genre: that warming from greenhouse gasses will be greatest in the upper troposphere above the tropics. This is demonstrated by this graph on page 21 of the GCCI

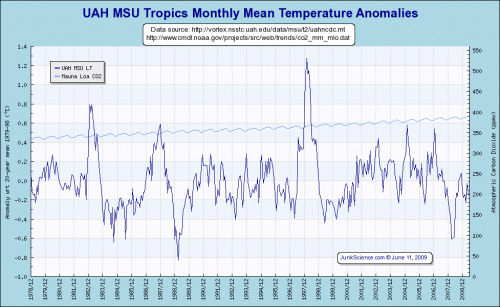
This has always been a stumbling block, because satellites, the best measures we have on the troposphere, and weather balloons have never seen this heat bubble over the tropics. Here is the UAH data for the mid-troposphere temperature — one can see absolutely no warming in a zone where the warming should, by the models, be high:
Angell in 2005 and Sterin in 2001 similarly found from Radiosonde records about 0.2C of warming since the early 1960s, below the global surface average warming when models say it should be well above.
But fortunately, the GCCI solves this conundrum:
For over a decade, one aspect of the climate change story seemed to show a significant difference between models and observations.
In the tropics, all models predicted that with a rise in greenhouse gases, the troposphere would be expected to warm more rapidly than the surface. Observations from weather balloons, satellites, and surface thermometers seemed to show the opposite behavior (more rapid warming of the surface than the troposphere). This issue was a stumbling block in our understanding of the causes of climate change. It is now largely resolved. Research showed that there were large uncertainties in the satellite and weather balloon data. When uncertainties in models and observations are properly accounted for, newer observational data sets (with better treatment of known problems) are in agreement with climate model results.
What does this mean? It means that if we throw in some correction factors that make observations match the theory, then the observations will match the theory. This statement is a pure out and out wishful thinking. The charts above predict a 2+ degree F warming in the troposphere from 1958-1999, or nearly 0.3C per decade. No study has measured anything close to this – Satellites show 0.0C per decade and radiosondes about 0.05C per decade. The correction factors to make reality match the theory would have to be 10 times the measured anomaly. Even if this were the case, the implied signal to noise ratio would be so low as to render the analysis meaningless.
Frankly, the statement by these folks that weather balloon data and satellites have large uncertainties is hilarious. While this is probably true, these uncertainties and inherent biases are DWARFED by the biases, issues, uncertainties and outright errors in the surface temperature record. Of course, the report uses this surface temperature record absolutely uncritically, ignoring a myriad of problems such as these and these. Why the difference? Because observations from the flawed surface temperature record better fit their theories and models. Sometimes I think these guys should have put a picture of Ptolemy on their cover.


I tremble a little to take issue (since I concur wholeheartedly with so much of what you write, here and elsewhere), but I think that Aristotle has got a bit of a bum rap.
During our first year mechanics lectures at Imperial College, back in 1976, our lecturer reminded us of the expected motion of a Newtonian cannonball, and an Aristotelian one. We sniggered and mocked. He then pointed out that Aristotelian mechanics is dominated by friction, whereas Newtonian is dominated by momentum. Having looked at a perfect Newtonian cannonball (a 1 inch ball-bearing), he then suggested that we consider an Aristotelian cannon – more sniggering. Out from behind the table came a balloon and a badminton racket. He hit the balloon upwards at an angle of 45 degrees, and a perfect Aristotelian motion was observed – a brief “straight motion” of a few feet, a “curved motion” of another foot or so, followed by a “falling motion” to the floor.
It was enlightening, particularly since it is a good metaphor for where we are now: an astonishingly vocal part of our society is convinced that we live in a world dominated by positive feedback – where balloons are used as cannonballs. By contrast, another group claim feedback is either not that important, or slightly to strongly negative – that cannonballs are usually made of steel – much denser than the air in which they fly, and encountering little friction compared to their momentum. Observation ought to enable us to determine what sort of world we *actually* live in, and so help us to formulate strategy. But observation is itself a polarized and politicised (but, alas, not in an Aristotelian sense)process.
What does this mean? It means that if we throw in some correction factors that make observations match the theory, then the observations will match the theory. This statement is a pure out and out wishful thinking.
Never mind being a tautology so perfect it belongs in a textbook of Logical Fallacies for Beginners.