Category Archives: Uncategorized

The Thought Experiment That First Made Me A Climate Skeptic

Please check out my Forbes post today.  Here is how it begins:

Last night, the accumulated years of being called an evil-Koch-funded-anti-science-tobacco-lawyer-Holocaust-Denier finally caught up with me.  I wrote something like 3000 words of indignation about climate alarmists corrupting the very definition of science by declaring their work “settled”, answering difficult scientific questions with the equivalent of voting, and telling everyone the way to be pro-science is to listen to self-designated authorities and shut up.  I looked at the draft this morning and while I agreed with everything written, I decided not to publish a whiny ode of victimization.  There are plenty of those floating around already.

And then, out of the blue, I received an email from a stranger.  Last year I had helped to sponsor a proposal to legalize gay marriage in Arizona.  I was doing some outreach to folks in the libertarian community who had no problem with gay marriage (after all, they are libertarians) but were concerned that marriage licensing should not be a government activity at all and were therefore lukewarm about our proposition.  I suppose I could have called them bigots, or homophobic, or in the pay of Big Hetero — but instead I gathered and presented data on the number of different laws, such as inheritance, where rights and privileges were tied to marriage.  I argued that the government was already deeply involved with marriage, and fairness therefore demanded that more people have access to these rights and privileges.  Just yesterday I had a reader send me an email that said, simply, “you changed my mind on gay marriage.”  It made my day.  If only climate discussion could work this way.

So I decided the right way to drive change in the climate debate is not to rant about it but instead to continue to model what I consider good behavior — fact-based discussion and a recognition that reasonable people can disagree without that disagreement implying one or the other has evil intentions or is mean-spirited.

This analysis was originally published about 8 years ago, and there is no longer an online version.  So for fun, I thought I would reproduce my original thought experiment on climate models that led me to the climate dark side.

I have been flattered over time that folks like Matt Ridley have picked up on bits and pieces of this analysis.  See it all here.

Insights on Climate Science, From Economics

I continue to be fascinated by parallels between climate science and economics.  In the past, I have mainly discussed how climate models have the same problems and abuses and shortcomings as macro-economic models.

I thought this post discussing Keynesian economics could easily been written about climate:

No small part of Keynes’s (and the Keynesians’s) success is due, I believe, to their dressing up in scientific jargon and garb what are, at bottom, little more than ad hoc excuses for people to follow “their first impulsive reactions.”  Keynesians’s pose as scientists – their substitution of scientism for science – masks their rejection of a genuinely scientific approach to the study of the economy.

A Really Bad Idea

I know lots of your disagree with me on this, but it needs to be said.  I have had people argue that , well, its about management of public funds, but compared to what the average university wastes, this is trivial.  The funds management issue is just window dressing, in my view, for people looking for a heaping helping of retribution. Cross posted from Coyote Blog

Regular readers will have no doubts about my skepticism of the theory of catastrophic man-made global warming.  In particular, in these pages and at Coyote Blog, I have repeatedly criticized the details of Michael Mann’s work on the hockey stick.  I won’t repeat those issues today, though some of the past articles are indexed here.  Or watch my video linked to the right, it has plenty of stuff about the hockey stick.

That being said, efforts by Republicans in Virginia to bring legislative or even criminal action against Mann for his work when he was at the University of Virginia is about the worst idea I have heard in quite some time.  Though nominally about forcing public disclosure (something I am always in favor of from state entities) the ultimate goal is to drag Mann into court

Cuccinelli has said he wants to see whether a fraud investigation would be warranted into Mann’s work, which showed that the earth has experienced a rapid, recent warming

[As an aside, this is actually NOT what Mann’s hockey stick work purports to show.  The point of the hockey stick is to make the case that historic temperatures before 1850 were incredibly stable and flat, and thus recent increases of 0.6-0.8C over the last 150 years are unprecedented in comparison.   His research added nothing to our knowledge about recent warming, it was on focused on pre-industrial warming.   The same folks that say with confidence the science is settled don’t even understand it].

For those frustrated with just how bad Mann’s work is and upset at the incredible effort to protect this work from criticism or scrutiny by hiding key data (as documented in the East Anglia climategate emails), I know it must feel good to get some sort of public retribution.  But the potential precedent here of bringing up scientists on charges essentially for sloppy or incorrect work is awful.

Bad science happens all the time, completely absent any evil conspiracies.  Human nature is to see only the data that confirms ones hypotheses and, if possible, to resists scrutiny and criticism.  This happens all the time in science and if we started hauling everyone into court or into a Senate committee, we have half of academia there  (and then likely the other half when the party in power changed).  Team politics are a terrible disease and the last thing we need is to drag them any further into science and academia.

Science will eventually right itself, and what is needed is simply the time and openness to allow adversarial scrutiny and replication within academia to run its course.  Seriously, are we next going to drag the cold fusion guys in to court?  How about all the folks in the geology field that resisted plate tectonics for so long.  Will we call to account the losers in the string theory debate?

If legislators want to help, they can

  • Make sure there are standards in place for archiving and public availability of any data and code associated with government funded research
  • Improve the governments own climate data management
  • Ensure that state funding is distributed in a way to support a rich dialog on multiple sides of contested scientific issues.

Defending Science, Not Global Warming Science Per Se

This quote from an upcoming paper by Mike Hulme has been making the blog rounds of late:

Claims such as ‘2,500 of the world’s leading scientists have reached a consensus that human activities are having a significant influence on the climate’ are disingenuous. That particular consensus judgement, as are many others in the IPCC reports, is reached by only a few dozen experts in the specific field of detection and attribution studies; other IPCC authors are experts in other fields.

I have not really written on this statement because its such old news.  This has been known for years, just not broadly reported.  So its good that this is getting more attention, but this is one reason I have not been blogging much on this site lately — while I am happy that things skeptics have known for years are finally reaching more popular media, I am not that interested in reporting on every such “revelation.”  “World is round, story at 11” does not really get me that excited.

However, I did want to answer one question I get a lot from audiences when I speak about the whole consensus thing.  Because many climate scientists and scientists in other fields and other academics do pile on and sign letters and petitions in support of the catastrophic global warming hypothesis.  People ask me how I can be right when there are so many showing support for the opposite position.

What I tell them is that these folks are not really showing support for the catastrophic global warming position in the sense that they have studied and reviewed the science in depth and found it compelling.  What they are really doing when they make these statements or sign letters is showing support for science itself.  The irony is they are doing just the opposite, but let me explain.

I was not a big fan of George W. Bush.  But universities absolutely, almost to a person, hated him with a crazy-deep passion.  They became convinced (right or wrong) that he was the leader of a Christian fundamental effort to subvert all science in favor of religious orthodoxy.  The leaders of the catastrophic global warming movement have been very successful in feeding off this passion, and portraying opposition to catastrophic anthropogenic global warming theory as part and parcel of this religious fundamentalist attack on all science.  They have successfully linked, in the minds of academics and many of the public, that disagreeing with James Hansen or critiquing the Hockey stick is the equivalent of being anti-science.

So when some biology professor at Berkely signs a statement in support of catastrophic global warming theory, it does not mean that she has looked at the strong positive feedback assumptions in climate models and found them reasonable.  It means she believes herself to be supporting science against the medieval barbarians at the gate.

The irony is that in fact they are doing the opposite.  In trying to oppose religious orthodoxy they have in fact supported scientists who treat their pet theory like a religious orthodoxy, and all opposition to it as heresy.   And in trying to support science, they have supported folks who have broken many of the most fundamental rules of modern science, including the avoidance of replication, the hiding of results and data, and corruption of the peer review process.

This may be why I underestimated the impact of the CRU email release.  In retrospect, I can imagine all those scientists that used to sign these petitions looking at what the CRU emails and thinking, “this is what I have defended as true science?”

New Alarmist Research

Via the USA Today:

Worried your mate might be headed for greener pastures? A biology study suggests you could cry “wolf”, or rather “lion”, to keep them home on the range, at least as long as you are an antelope.

A study in the forthcoming July edition of The American Naturalist journal by Jakob Bro-Jørgensen of the United Kingdom’s Liverpool University and Wiline Pangle of Michigan State University, finds false lion warnings are used to deter straying mates among topi antelope in Kenya’s Masai Mara National Reserve. The study calls this a first documented case of such sexual deception by false alarms.

“Here, we report that false alarm snorts are used by male topi antelopes (Damaliscus lunatus) to tactically deceive receptive females who intend to leave a male’s territory into believing that they are headed toward a predator,” says the study. “Consequentially, the departure of the female is delayed, providing the male with additional mating opportunities.”

Humans just take their dates to an Al Gore rally.

Weird

What an odd world we live in when environmental activists feel the need to write about how horrible grass and open parks can be for the environment.

You may recently have come to accept that lawns are bad for the planet.

Isn’t it amazing someone can assume his readers accept this statement so much that he can use it as a starting point?  He goes on to discuss when public spaces are and are not bad for the environment.

It is incredible to me that somehow we have reached a world where absurdly dense urban living a la Manhattan is considered the most environmentally friendly way for humans to live.  All just another way in which an obsession with CO2 has corrupted the environmental movement.  I have predicted it before but will say it again — some day, the environmentalists will look back on their global warming hysteria as a couple of lost decades in their own movement, when focus on real environmental issues were kicked to the curb in favor of going all in on trace concentrations of carbon dioxide.

Global Warming “Accelerating”

I have written a number of times about the “global warming accelerating” meme.  The evidence is nearly irrefutable that over the last 10 years, for whatever reason, the pace of global warming has decelerated (click below to enlarge)
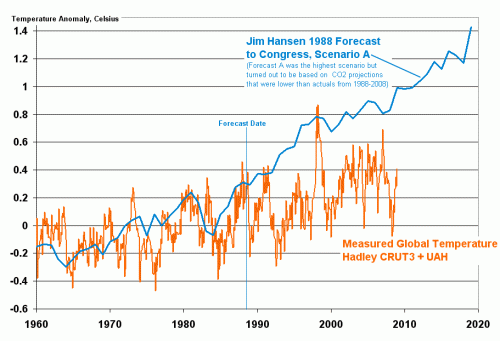
hansenjan20091

This is simply a fact, though of course it does not necessarily “prove” that the theory of catastrophic anthropogenic global warming is incorrect.  Current results continue to be fairly consistent with my personal theory, that man-made CO2 may add 0.5-1C to global temperatures over the next century (below alarmist estimates), but that this warming may be swamped at times by natural climactic fluctuations that alarmists tend to under-estimate.

Anyway, in this context, I keep seeing stuff like this headline in the WaPo

Scientists:  Pace of Climate change Exceeds Estimates

This headline seems to clearly imply that the measured pace of actual climate change is exceeding previous predictions and forecasts.   This seems odd since we know that temperatures have flattened recently.  Well, here is the actual text:

The pace of global warming is likely to be much faster than recent predictions, because industrial greenhouse gas emissions have increased more quickly than expected and higher temperatures are triggering self-reinforcing feedback mechanisms in global ecosystems, scientists said Saturday.

“We are basically looking now at a future climate that’s beyond anything we’ve considered seriously in climate model simulations,” Christopher Field, founding director of the Carnegie Institution’s Department of Global Ecology at Stanford University, said at the annual meeting of the American Association for the Advancement of Science.

So in fact, based on the first two paragraphs, in true major media tradition, the headline is a total lie.  In fact, the correct headline is:

“Scientists Have Raised Their Forecasts for Future Warming”

Right?  I mean, this is all the story is saying, is that based on increased CO2 production, climate scientists think their forecasts of warming should be raised.  This is not surprising, because their models assume a direct positive relationship between CO2 and temperature.

The other half of the statement, that “higher temperatures are triggering self-reinforcing feedback mechanisms in global ecosystems” is a gross exaggeration of the state of scientific knowledge.  In fact, there is very little good understanding of climate feedback as a whole.  While we may understand individual pieces – ie this particular piece is a positive feedback – we have no clue as to how the whole thing adds up.  (see my video here for more discussion of feedback)

In fact, I have always argued that the climate models’ assumptions of strong positive feedback (they assume really, really high levels) is totally unrealistic for a long-term stable system.  In fact, if we are really seeing runaway feedbacks triggered after the less than one degree of warming we have had over the last century, it boggles the mind how the Earth has staggered through the last 5 billion years without a climate runaway.

All this article is saying is “we are raising our feedback assumptions higher than even the ridiculously high assumptions we were already using.”  There is absolutely no new confirmatory evidence here.

But this creates a problem for alarmists

For you see, their forecasts have consistently demonstrated themselves to be too high.  You can see above how Hansen’s forecast to Congress 20 years ago has played out (and the Hansen A case was actually based on a CO2 growth forecast that has turned out to be too low).  Lucia, who tends to be scrupulously fair about such things, shows the more recent IPCC models just dancing on the edge of being more than 2 standard deviations higher than actual measured results.

But here is the problem:  The creators of these models are now saying that actual CO2 production, which is the key input to their model, is far exceeding their predictions.  So, presumably, if they re-ran their predictions using actual CO2 data, they would get even higher temperature forecasts. Further, they are saying that the feedback multiplier in their models should be higher as well.  But the forecasts of their models are already high vs. observations — this will even cause them to diverge further from actual measurements.

So here is the real disconnect of the model:  If you tell me that modelers underestimated the key input (CO2) in their models,  and have so far overestimated the key output (Temperature), I would have said the conclusion to this article is that climate sensitivity must be lower than what was embedded in the models.  But they are saying exactly the opposite.  How is this possible?

Postscript: I hope readers understand this, but it is worth saying because clearly reporters do not understand this:  There is no way that climate change from CO2 can be accelerating if global warming is not accelerating.  There is no mechanism I have ever heard by which CO2 can change the climate without the intermediate step of raising temperatures.  Co2–>temperature increase–>changes in the climate.

Update: Chart originally said 1998 forecast.  Has been corrected to 1988.

Update#2: I am really tired of having to re-explain the choice of using Hansen’s “A” forecast, but I will do it again.  Hansen had forecasts A, B, C, with A being based on more CO2 than B, and B with more CO2 than C.  At the time, Hansen said he thought the A case was extreme.  This is then used by his apologists to say that I am somehow corrupting Hansen’s intent or taking him out of context by using the A case, because Hansen himself at the time said the A case was probably high.

But the only difference between A, B, and C were not the model assumptions of climate sensitivity or any other variable — they only differed in the amount of Co2 growth and the number of volcano eruptions (which have a cooling effect via aerosols).  We can go back and decide for ourselves which case turned out to be the most or least conservative.   As it turns out, all three cases UNDERESTIMATED the amount of CO2 man produced in the last 20 years.  So, we should not really use any of these lines as representative, but Scenario A is by far the closest.  The other two are way, way below our actual CO2 history.

The people arguing to use, say, the C scenario for comparison are being disingenuous.  The C scenario, while closer to reality in its temperature forecast, was based on an assumption of a freeze in Co2 production levels, something that obviously did not occur.

The Magic Correlation

This discussion, including the comments, over at Climate Audit, really is amazing.  Just when you think all the procedural errors that could be mined from the Mann hockey stick have been pulled to the surface, another gem emerges.

Here is how I understand it (please correct me if I am wrong in the comments):  Michael Mann uses a variety of proxies to reconstruct history  (he actually pre-screens them to only use the ones that will give him the answer he wants, but that is another problem that has been detailed in other posts).  To be able to tell temperature with these proxies (since their original measurements are things like mm of tree ring width, not degrees) they must be scaled based on periods in which the thermometer-measured surface temperature record overlaps the proxy record.

Apparently, when making these calibrations, he used the surface temperature record from 1850-1995, but also did other runs with sub-periods of this, such as 1850-1949 and 1896-1995.  OK so far.  Well, McIntyre believes he has found that when running these correlations, the sign of the correlation factor for a single proxy actually changes.

What does this mean?  Well, lets assume proxy 1 is tree ring width from a particular tree, and a calibration based on 1850-1995 has such-and-such ring width data correlated at x per degree.   This means that an increase in ring width of X implies a temperature increase of one.  But, when calibrating on one of the other periods, the exact same proxy has a calibration of -Y.  This means that an increase in the ring width of Y yields a temperature DECREASE of one.

I had a professor of physics back in undergrad who used to just drive me crazy with his insistence on good error estimations in the lab  (which he was right to emphasize, just proving I was not meant for the lab).  He used to say that if your error range crossed zero, in other words, if your range of possible answers included both positive and negative numbers, then you really did not understand a process.  You don’t understand a relationship, he would say, if you don’t even know the sign.  Well, Mann has gotten over this little problem, I guess, because he is perfectly able to have the same physical process have exactly opposite relationships with temperature depending on what 50 year period he is working with.

OK, so Steve caught him with one bad proxy.  Heck, he has over a thousand others.  But now McIntyre is reporting in the comments he has found 308 such cases, where Mann has correlations that change signs like this.  Wow.

Postscript: By the way, one of the most fundamental rules of regression analysis is that when you throw a variable into the regression, you should have some theoretical reason for doing so.  This is because every single variable you add, no matter how spurious, is going to improve the fit of a regression (trust me on this, it’s in the math).

In the case of proxy regressions, it is simply unacceptable to rely on the regression for the sign.  You rely on physics for the sign, not the regression.   If you don’t even know the sign of the relationship between your proxy and temperature, then you don’t understand the proxy well enough physically to justify even calling it a proxy.

This is a big, big deal in financial modelling.  I can’t tell you how often it is emphasized in financial modelling to make sure you have a working theory as to how and why a variable should affect a regression, and then when you get the result, you need to test it against your original theory.  And if they are too far apart, you need to doubt the computer result.  Because in financial modelling, if you get too much confidence in regressions against spurius data, you can go bankrupt  (in climate, it instead seems to lead to fame, large grants, and hanging out with vice-presidents).

Update: Oops, I missed the first post on this at Climate Audit, which discusses the issues in my postscript in more depth.  This is a good example, and it is not surprising they revert to a financial example as I did, as financial modelers have the greatest immediate incentives not to fool themselves.

We (the authors of this paper) have identified a weather station whose temperature readings predict daily changes in the value of a specific set of stocks with a correlation of r=-0.87. For $50.00, we will provide the list of stocks to any interested reader. That way, you can buy the stocks every morning when the weather station posts a drop in temperature, and sell when the temperature goes up. Obviously, your potential profits here are enormous. But you may wonder: how did we find this correlation? The figure of -.87 was arrived at by separately computing the correlation between the readings of the weather station in Adak Island, Alaska, with each of the 3315 financial instruments available for the New York Stock Exchange (through the Mathematica function FinancialData) over the 10 days that the market was open between November 18th and December 3rd, 2008. We then averaged the correlation values of the stocks whose correlation exceeded a high threshold of our choosing, thus yielding the figure of -.87. Should you pay us for this investment strategy? Probably not: Of the 3,315 stocks assessed, some were sure to be correlated with the Adak Island temperature measurements simply by chance – and if we select just those (as our selection process would do), there was no doubt we would find a high average correlation. Thus, the final measure (the average correlation of a subset of stocks) was not independent of the selection criteria (how stocks were chosen): this, in essence, is the non-independence error. The fact that random noise in previous stock fluctuations aligned with the temperature readings is no reason to suspect that future fluctuations can be predicted by the same measure, and one would be wise to keep one’s money far away from us, or any other such investment advisor

Update #2: I guess I have to issue a correction.  I have argued that climate scientists tend to be unique in trying to avoid criticism by labeling critics as “un-scientific”.  In retrospect, it does not appear climate scientists are unique:

The iconoclastic tone have attracted coverage on many blogs, including that of Newsweek. Those attacked say they have not had the chance to argue their case in the normal academic channels. “I first heard about this when I got a call from a journalist,” comments neuroscientist Tania Singer of the University of Zurich, Switzerland, whose papers on empathy are listed as examples of bad analytical practice. “I was shocked — this is not the way that scientific discourse should take place.”

“Anti-Scientific”

From Joe Romm, via Tom Nelson

The finalist list is out for the 2008 Weblog awards “Best Science Blog,” and two of the ten finalists are anti-scientific websites primarily devoted to spreading disinformation (and noninformation) on global warming– just like 2007.

The 2007 “competition” ended up being yet another classic exercise in the right wing perverting an otherwise reasonable web idea — online voting for the best science blog. As Desmogblog explained in a post titled, The “Vast Right Wing Conspiracy” beating “Vast Left Wing” Voting for Best Science Weblog, the right wing voted en masse for Climate Audit and the rational people all voted for Discover magazine’s excellent Bad Astronomy Blog. In the end, the process was so controverisal that the Awards folk simply called it a tie — saying each blog ended up with exactly 20,000 votes.

The Weblog Awards should not be legitimizing anti-scientific denialism.

As a student of history, I try really hard to never use the word “unprecedented.”  For example, those who think the partisan bickering we have today is somehow at a peak should go back to any American paper in 1855 and take a gander at the vitriol that flew back and forth.

But I must say I do find it difficult to find a good historical analog for this whole “anti-scientific” knock on climate skeptics.  I can understand accusing others of being wrong on a topic in science.   For example, it took decades for plate tectonics theory to catch on outside of small fringes of the geologic community, but I don’t remember folks accusing others of being anti-scientific.

This is particularly true in the case of the two blogs Mr. Romm mentions.   Here are a couple of quick thoughts:

  • Steve McIntyre, at Climate Audit, spends most of his time trying (in great, statistical depth) trying to replicate work by scientists such as Michael Mann and James Hansen, and critiques their work when he thinks he finds flaws.  Mann and Hansen spend much of their time trying to stonewall Mr. McIntyre and prevent him from having access to their data (most of which was collected and analyzed at taxpayer expense, either directly or through government grants).  Which of these parties seems closer to the spirit of science.
  • Anthony Watt argued for years with the government operators of the surface temperature measurement network that their system had location biases that were not being taken into account, and that were much large than being acknowledged.  When the operators of these systems were uninterested in pursuing the matter, Watt started a volunteer effort to survey and photograph these stations to the location biases, where they may exist, would be visible and available for anyone who wished to see.
  • Only one side in this debate ever argues that the other should be banned from even speaking or being heard.  I think you know which one that is.  So which side is the one that is “anti-science” — the one that is happy to mix it up in open debate or the one that is trying to get its opposition silenced?

Again, Watt and McIntyre could be wrong, but their sites are often scientific.  I could easily name 10 climate skeptic sites that, while I wouldn’t call them anti-science, are certainly a-scientific, focusing more on polemic than data.  But I could do the exact same on the alarmist side.  Certainly Watt and McIntyre’s sites are not in this category.

Here is the best analogy I can come up with (one which, not being religious myself, hopefully I can portray with a bit of detachment).   During the reformation, the Catholic Church accused critics of the Church of being anti-Christian.  But the religious skeptics were not anti-Christian per se, they merely contested the Church’s (and the Pope’s) ability to speak with absolute authority on religious matters.  In this case, the priests of the Church were upset that their monopoly to speak for Church doctrine was being challenged. They challenged their opposition as being anti-religious, but what they were was actually against the established Church, doctrine, and priesthood.

And by the way, is any actual adult human being with more than a year experience blogging really surprised that voting on the Internet

More on the Sun

I wouldn’t say that I am a total sun hawk, meaning that I believe the sun and natural trends are 100% to blame for global warming. I don’t think it unreasonable to posit that once all the natural effects are unwound, man-made CO2 may be contributing a 0.5-1.0C a century trend (note this is far below alarmist forecasts).

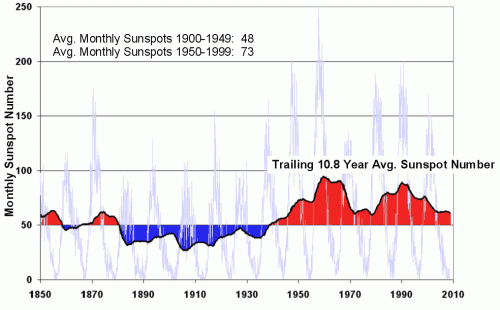
But the sun almost had to be an important fact in late 20th century warming. Previously, I have shown this chart of sunspot activity over the last century, demonstrating a much higher level of solar activity in the second half than the first (the 10.8 year moving average was selected as the average length of a 20th century sunspot cycle).
sunspot2

Alec Rawls has an interesting point to make about how folks are considering the sun’s effect on climate:

Over and over again the alarmists claim that late 20th century warming can’t be caused by the solar-magnetic effects because there was no upward trend in solar activity between 1975 and 2000, when temperatures were rising. As Lockwood and Fröhlich put it last year:

Since about 1985,… the cosmic ray count [inversely related to solar activity] had been increasing, which should have led to a temperature fall if the theory is correct – instead, the Earth has been warming. … This should settle the debate.

Morons. It is the levels of solar activity and galactic cosmic radiation that matter, not whether they are going up or down. Solar activity jumped up to “grand maximum” levels in the 1940’s and stayed there (averaged across the 11 year solar cycles) until 2000. Solar activity doesn’t have to keep going up for warming to occur. Turn the gas burner under a pot of stew to high and the stew will heat. You don’t have to keep turning the flame up further and further to keep getting heating!

Update: A commenter argues that I am simplistic and immature in this post.  I find this odd, I guess, for the following reason.  One group tends to argue that the sun is largely irrelevant to the past century’s temperature increases.  Another argues that the sun is the main or only driver.  I argue that the evidence seems to point to it being a mix, with the sun explaining some but not all of the 20th century increase, and I am the one who is simplistic?

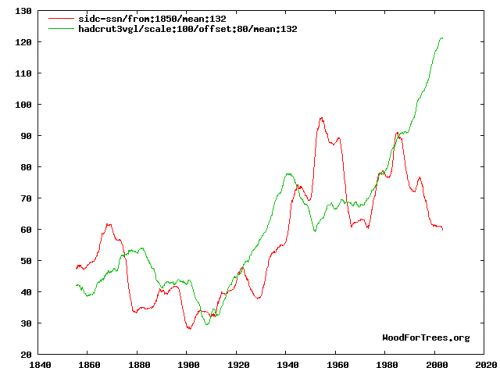
The commenter links to this graph, which I will include.  It is a comparison of the Hadley CRUT3 global temperature index (green) and sunspot numbers (red):

mean-132

Since I am so ridiculously immature, I guess I don’t trust myself to interpret this chart, but I would have happily used this chart myself had I had access to it originally.  Its wildly dangerous to try to visually interpret data and data correlations, but I don’t think it is unreasonable to say that there might be a relationship between these two data sets.  Certainly not 100%, but then again the same could easily be said of the relationship of temperature to Co2.  The same type of inconsistencies the commenter points out in this correlation could easily be made for Co2 (e.g., why, if CO2 was increasing, and in fact accelerating, were temps in 1980 lower than 1940?

The answer, of course, is that climate is complicated.  But I see nothing in this chart that is inconsistent with the hypothesis that the sun might have been responsible for half of the 20th century warming.  And if Co2 is left with just 0.3-0.4C warming over the last century, it is a very tough road to get from past warming to sensitivities as high as 3C or greater.  I have all along contended that Co2 will likely drive 0.5-1.0C warming over the next century, and see nothing in this chart that makes me want to change that prediction.

Update #2: I guess I must be bored tonight, because commenter Jennifer has inspired me to go beyond my usual policy of not mixing it up much in the comments section.  A lengthy response to her criticism is here.

Whew! Done.

OK, I think I have finally, successfully migrated both my blogs from the Typepad ASP service to self-hosted WordPress. Many of you on feeds may have gotten a one-time slug of about 10 old posts in your feed (sorry). This was an artifact of the change of feed sources toFeedburner and should not happen again. Overall, I am very pleased with the results. The sites look better , they are easier to modify, they run faster, and the back-end interface is MUCH better. Most of you don’t care, but I will post on the process I followed to migrate as a repayment to others whose past such posts helped me through the process.

If you are getting this post, you should not have to change any of your settings. Enjoy.

Don’t Count Those Skeptics Out

From Mark Scousen in "Making Modern Economics"

Ironically, by the time of the thirteenth edition [of Paul Samuelsons popular economics textbook], right before the Berlin Wall was torn down, Samuleson and Nordhaus confidently declared, "The Soviet economy is proof that, contrary to what many skeptics believed [a reference to Mises and Hayek], a socialist command economy can function and even thrive."  From this online excerpt.


Climate Tourism

While driving between some of the campgrounds we run in Inyo and Mono County, California, I stumbled across the White Mountain bristle-cone pine forest.  I just couldn’t resist checking it out.  Of course, it through me off my schedule for an hour or so, but its not the first time that bristle-cones have been a source of divergence ;=)

PS-  I had a crappy rent car, but if you have a sports car and are near Highway 168 east of Big Pine, CA, you should definitely give it a test drive.  It would be a real hoot to drive with the right car.

Comments on NOAA USP Draft

As promised, here are my comments on the USP Global Climate Change draft.  I simply did not have the time to plow through the entire NOAA/NASA CCSP climate change report, so I focused on the 28-page section labeled Global Climate Change.  Even then, I was time-crunched, so most of my comments are cut-and-pastes from my blog, and many lack complete citations.  I would feel bad about that, except the USP report itself is very clearly a haphazard cut-and-paste from various sources and many of its comments and charts totally lack citations and sources (I challenge you to try to figure out even simple things, like where the 20th century temperature data on certain charts came from).

Another Assessment of Hansen’s Predictions

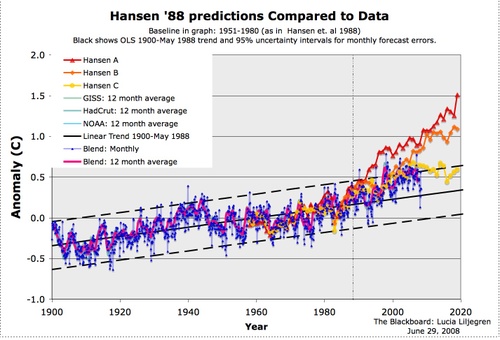
The Blackboard has done a bit more work to do a better assessment of Hansen’s forecast to Congress 20 years ago on global warming than I did in this quick and dirty post here.  To give Hansen every possible chance, the author has evaluated Hansen’s forecast against Hansen’s preferred data set, the surface temperature measurements of the Hadley Center and his own GISS  (left to other posts will be irony of a scientist at the Goddard Institute of Space Studies at NASA preferring klunky surface temperature measurements over satellite measurements, but the surface measurements are biased upwards and so give Hansen a better shot at being correct with his catastrophic warming forecasts).

Here is the result of their analysis:

Hansenlineartrend

All three forecasts are high. 

Don’t be too encouraged at Hansen’s prediction power when you observe the yellow line is not too far off. The yellow line represented a case where there was a radical effort to reduce CO2, something we have not seen.  Note that these are not different cases for different climate sensitivities to CO2 — my reading of Hansen’s notes is that these all use the same sensitivity, just with different CO2 production forecast inputs. In fact, based on our actual CO2 ouput in the last 20 years, we should use a case between the orange and the red to evaluate Hansen’s predictive ability.

Polar Bears and Combustion

The biggest danger to polar bears may not be combustion, but incomplete combustion.  Inefficient or incomplete combustion can lead to carbon particles or dense hydrocarbons going up the smokestack (or exhaust pipe).  We commonly call this soot.  It is one reason white marble buildings in cities look so dingy, and it is a pollution problem we have done a lot with in the US but is way down the priority scale in places like China.

It turns out, though, that soot may have more to do with melting ice and rising arctic temperatures than CO2, and this is actually good news:

“Belching from smokestacks, tailpipes and even forest fires, soot—or black carbon—can quickly sully any snow on which it happens to land. In the atmosphere, such aerosols can significantly cool the planet by scattering incoming radiation or helping form clouds that deflect incoming light. But on snow—even at concentrations below five parts per billion—such dark carbon triggers melting, and may be responsible for as much as 94 percent of Arctic warming.

“Impurities cause the snow to darken and absorb more sunlight,” says Charlie Zender, a climate physicist at the University of California, Irvine. “A surprisingly large temperature response is caused by a surprisingly small amount of impurities in snow in polar regions.”

Zender, physicist Mark Flanner and other colleagues built a model to examine how soot impacts temperature in the Arctic and Antarctic regions. Temperatures in the northern polar region have already risen by 1.6 degrees Celsius (2.88 degrees Fahrenheit) since the dawn of the Industrial Revolution. The researchers incorporated information on soot produced by burning fossil fuels, wood and other biofuels, along with that naturally produced by forest fires and then checked their model predictions against global measurements of soot levels in polar snow from Sweden to Alaska to Russia and in Antarctica as well as in nonpolar areas such as the Tibetan Plateau….

Whereas forest fires contribute to the problem—the effect noticeably worsens in years with widespread boreal wildfires—roughly 80 percent of polar soot can be traced to human burning, adding as much as 0.054 watt of energy per square meter of Arctic land, according to the research published this week in the Journal of Geophysical Research. When the snow melts, it exposes dark land below it, further accelerating regional warming. “Black carbon in snow causes about three times the temperature change as carbon dioxide in the atmosphere,” Zender says. “The climate is more responsive to this than [to] anything else we know.”

If correct, this is an incredibly powerful finding, for a couple of reasons.  First, over the last 30 years since we have had good satellite temperature measurements, the vast majority of the warming has been in the Arctic, with temperatures flat to down in the tropics and the Antarctic.  This has never made much sense in the context of greenhouse warming theory (though its proponents have tied themselves into pretzels trying to explain it) since global warming theory (as embodied in the last IPCC report) holds that the largest temperature gains should be in the lower troposphere over the tropics, and offers no reason why the warming in the Artic should be orders of magnitude larger than in the Antarctic. 

But this soot theory turns it all around.  By this theory, the warming of the Arctic partially results from the loss of ice, rather than the other way around.  And no one would deny that the Artic should have much more soot than the Antarctic, since Northern Hemisphere industrial output dwarfs that of the Southern Hemisphere (and most all soot stays in the hemisphere in which it was created).  This would help explain the differential vs the tropics (soot has less effect on warming when it falls on a rain forest than on snow) as well as the differential between Artic and Antarctic.

But the theory is powerful for another reason:  It would be MUCH easier to engage in a global effort to reduce soot substantially.  While CO2 is a necessary bi-product of combustion, soot is not.  Better furnace design and exhaust gas scrubbing, as well as some gasoline reformulations and internal combustion tweaks, would make an enormous dent in soot production, an effort I would gladly support.

Postscript:  You may actually have heard of black carbon in the context of global warming.  Over the last decade, when climate alarmists began running their catastrophic warming models backwards, they found they vastly over-predicted past warming.  To save their models (god forbid anyone would rethink the theory) they cast about for potential man-made cooling effects that might be masking or offsetting man-made warming.  In this context, they settled on sulfur dioxide aerosols and black carbon as cooling agents (which they are, at least to some extent).  Not having a good theory on how much cooling the cause, they could assign arbitrarily large numbers to them, in effect making them the "plug" to get their models to fit history.

With a bit more research, scientists are beginning to admit the cooling effect can’t be that great.  The reason is that unlike CO2, black carbon and aerosols break down and come to earth  (as soot and acid rain) relatively quickly, so that they have only limited, local effects in the areas in which they are produced.  At most, a third of the world’s land area or about 8% of the entire earth’s surface had any kind of concentrations of these in the atmosphere.  To have a cooling effect of .5-1.0C (which is what they needed, at a minimum, to make their models work running backwards) would imply aerosols were cooling these selected areas of effect by 6-12 degrees Celsius, which was totally improbable.  Besides, almost all of these aerosols are in the norther hemisphere, but it has been the southern hemisphere that has been cooler. 

Price / Value of Solar

I have a big four thousand square foot roof in one of the greatest solar sites in the world (6 equivilent hours of full sun a day) that is just begging for solar panels.  Except that even with substantial government subsidies, the payback numbers are awful. Lynne Keisling reports that this may be about to change:

There are a couple of very interesting recent solar developments that have substantial economic implications. First, the blue sky stuff: courtesy of Slashdot, a team of researchers in the Netherlands have demonstrated avalanche effects in semiconductors that can be used in solar cells (here’s the original article). Avalanche effects mean that instead of having a 1:1 relationship between a photon and an electron, in which 1 photon releases 1 electron, it’s physically possible in these nano-scale semiconducting materials to have 2:1 or even 3:1 — 2 or 3 electrons released per photon in the material. This means twofold or threefold increase in the possible energy intensity of the solar cell material. These nanocrystals are even inexpensive to manufacture. How cool is that?

What are the economic implications of this new material and new knowledge? The low energy intensity of solar cells has been a factor in making solar a less cost-effective means of generating electricity than fossil fuels, which are extremely energy intensive. This avalanche effect can mean smaller, more energy intensive solar cells, which changes the cost structure for solar. I think it will certainly shift the long-run average cost curve downward, which creates an opportunity for solar retailers to reduce prices. A lower solar retail price shifts the price ratio between solar power and all other electricity power sources. For example, the price ratio between solar-generated and coal-generated electricity would shift such that at the margin, consumers would substitute out of coal-powered electricity and into solar-powered electricity. If I were better at generating the isoquant and indifference curve graphs electronically, I’d show it here graphically … but the logic is straightforward.

Unfortunately, we have been hearing this for years.  I price solar out on my home just about once per year, and the numbers have not changed for a while.  Here’s hpoing….