
For those who have not seen it, Roy Spencer has a new paper on the PDO, clouds and temperature history.
I have never explicitly stated this, but my sense is that medium to long scale 20th century temperature trends can be explained mostly through three drivers:
1. A cyclical variation driven by multi-decade oceanic cycles like the Pacific Decadal Oscillation (PDO):

2. Changes in solar output, either directly as increased heating or indirectly via a variety of theories on things like cosmic rays and cloud formation:

3. A long term trend of up to +0.05C per decade that may include a CO2-warming component.
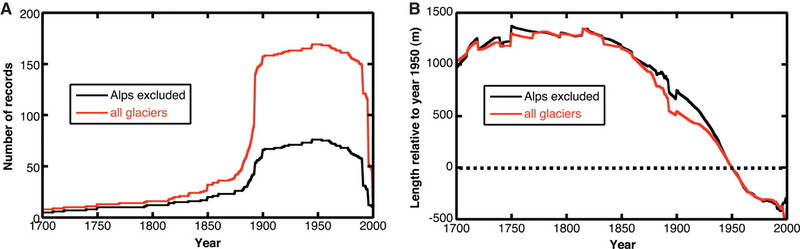
I am willing to posit a CO2 impact net of feedbacks of perhaps 0.5-1.0C over the next century. This may appear low, but is the only scale of number reasonably supported by history. Any higher number would result in temperatures way too high historically. And even assuming a number this high runs into the following problem: There was probably a trend of about this magnitude emerging from the little ice age 200+ years ago and extending into the 20th century. You can see it in the glacier numbers below: (source)

Those that want to assign the temperature trend, once the sun and the PDO are removed, post-1950 to CO2, need to explain what effect was causing the nearly exact same trend from 1800-1950, and why that trend conveniently switched off at the exact moment man's CO2 takes over. In the context of the glacier chart, what was causing the glaciers to retreat in 1880, and why is that effect not the one at work today?
1. a cyclical variation by definition cannot explain an upward trend in temperature
2. Numerous studies have found that solar variation cannot explain recent rises in temperature. This is a press release, and this is a paper.
3. the exact moment man’s CO2 takes over – there was no such moment. what was causing the glaciers to retreat in 1880 – anthropogenic climate forcing. and why is that effect not the one at work today? – it is.
That first chart reminds me of secular Bear and Bull market cycles.
a cyclical variation by definition cannot explain an upward trend in temperature
What? Doesn’t a cyclical variation go up and down? Won’t there be an upward trend and then a downward trend? Hasn’t that been the history of the world’s climate — temperature goes up and then it goes down. Repeat.
Numerous studies have found that solar variation cannot explain recent rises in temperature
And yet numerous other studies found solar variation can and does.
Hasn’t that been the history of the world’s climate — temperature goes up and then it goes down – it takes impressive self-blinkering not to even be able to see the graph in this post that contradicts that statement.
And yet numerous other studies found solar variation can and does. – no, they haven’t.
Yes, numerous studies proved that solar activity cannot explain more than 30% of the observed warming.
Jeff,
So now AGW was driving glaciers in the 19th century?
as for your assertions about cyclical movement vs. trend, and the history of the world’s temps, I would point out that playing with axis scales can emphasize or hide many things.
For you to deny that temps over time have gone up and down is, I think any reasonable person would observe, a better example of impressive self-blinkering.
Far from disputing an glbal warming trend overlaid on the cyclical PDO phases (and remember, there’s a difference between phased, or cyclical, and strictly periodic patterns), Roy’s latest papers attribute two-thirds of the increase to cloud-cover as correlted to the PDO. His study leaves adequate room for most of the remaining third to be ascribed to other solar effects including mantle heating and sunspot gamma-ray emmissions as they influence cloud-cover. The hat-tip to any CO2 die-hards is just that: a friendly gesture — it certainly can’t be take as proposing that human activity in 1850 melted any glaciers.
hunter – if you look up CO2 concentrations, you can work out what the forcing was from rising CO2 in the 19th century. Was it zero, positive or negative? You tell us.
Gary Knight, Ph. D – you must think that your PhD is relevant. Is it in a climate-related field?
Hadcrut2 data, classified by hemisphere and season and resolved into linear trends and deviations from trends, reveal that the maximum trend increase, 0.51 degrees Celsius per 100 years, occurs in the northern winter. Winter trends are higher than summer’s in both hemispheres, the northern difference being four times the southern one.
Charting the 30-year moving average deviation from trend displays the cyclical nature of the temperature record. A “W” pattern is evident in both hemispheres, more stable in the southern one. The initial downward leg of the “W” is a long cooling and the final upward leg, the long current warming. The middle bits are mini-warmings and coolings.The middle part of the “W” is more pronounced in the northern hemisphere, particularly in the September-November autumn when the sun is exiting the hemisphere.
What might explain these hemispherical and seasonal differences? It seems likely that the north’s predominance of land and population relative to the south, which is mostly ocean, is highly relevant. It also seems reasonable to assume that more heat is generated in autumn and winter than in spring and summer and that over time the quantity of heat generated would increase with population. In other words, inadequate correction in the data for the urban heat island effect appears as a likely explanation.
I’m a bit puzzled by the absence of any discussion related to the physical generation of heat that results from our energy usage. There was a fairly good paper (or at least it made sense to me, “Global Warming is global energy storage” by Bo Nordell, I think you can find it in Google) that talked about the human generated heat (not gases, but actual heat). I think your 3 points are excellent, and seem to correlate nicely to reality, but I would suggest you take a look at Bo’s paper and think about adding a 4th influence. Consider just the heat produced by automobiles, not a natural source in our climate, of which there are hundreds of millions, should not that have some (albeit small) measurable effect? Yet none of the skeptic sites seem to take any of this into account (no surprise that Realclimate would not consider it a significant source). Tom B.