I very seldom go wallowing about responding to comments in my comment threads. As I have posted before, I try to learn from criticisms in the comments and improve or modify my positions next time I post on a similar subject. Besides, I would lose my life to playing the troll game on climate issues.
However, I am sitting at home with some time on my hands and thought I would address a representative critical comment, from this post on the sun. Take this post as evidence, I guess, that I am perfectly capable of responding in depth to criticisms in the comments, had I this much time to spend with every one.
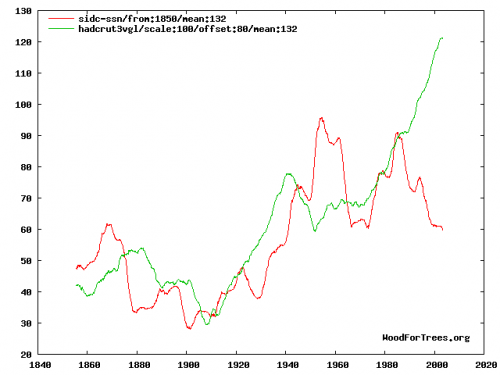
Staggering. You obviously haven’t read a single scholarly paper on this, or even looked at the data. This graph should dispel all your wrong-headed thinking. It’s the temperature, and monthly sunspot numbers, both plotted as 11 year running means (and scaled so that they roughly align). How, exactly, did rising temperatures in 1920 trigger increased solar activity 10 years later? Why did a peak in solar activity in the 1950s not correspond to a rise in temperatures then? Why do the green line and the red line diverge so wildly after 1985? Why is there basically hardly any correlation between solar activity and temperatures, over the last 150 years?
You betray a great immaturity on this web page, regurgitating the same nonsense time and again, calling people ‘morons’ and never even having the courtesy to respond when people tell you you’re wrong. When a fellow denialist tells you you’ve misrepresented him, and you don’t even bother to reply, let alone correct your error, what becomes crystal clear is that you’re simply dishonest.
A couple of responses:
- One of the great things about WordPress is that I have a nifty and powerful site search plugin (called Search Regex). I just searched every post on this site. The word “moron” has never, ever appeared on this site in text I have written. She puts moron in quotes, but I am fairly certain she is not quoting me. According to a Google search of this site, “moron” does appear 20-30 times in the comment section, usually wielded by my critics.
- When folks email me that I have made a mistake in quoting them, I post an update 100% of the time. However, I occasionally miss such notifications if they are posted the comments and not emailed to me. Believe it or not, I can go days without even glancing at this site or thinking about climate when the real job intervenes. But that is what comments are for. Unlike other climate sites that will remain nameless, *cough* realclimate *cough* I don’t moderate any comments, good, bad, or indifferent, except to eliminate outright spam. If you disagree or I screwed up, that’s what the comments are there for.
- The commenter argues that I am simplistic and immature in this post. I find this odd, I guess, for the following reason: One group out there tends to argue that the sun is largely irrelevant to the past century’s temperature increases. Another argues that the sun is the main or only driver. I argue that the evidence seems to point to it being a mix, with the sun explaining some but not all of the 20th century increase, and I am the one who is simplistic? Just for the record, I actually began the post with this:
“I wouldn’t say that I am a total sun hawk, meaning that I believe the sun and natural trends are 100% to blame for global warming. I don’t think it unreasonable to posit that once all the natural effects are unwound, man-made CO2 may be contributing a 0.5-1.0C a century trend”
- The commenter links to this graph, which I will include. It is a comparison of the Hadley CRUT3 global temperature index (green) and sunspot numbers (red):
Since I am so ridiculously immature, I guess I don’t trust myself to interpret this chart, but I would have happily used this chart myself had I had access to it originally (The chart uses a trailing 12 average of temperature as well as sunspots, which is why the line does not flatten and fall at the end. I have to think a bit if I accept this metric as the correct comparison).
It is wildly dangerous to try to visually interpret data and data correlations, but I don’t think it is unreasonable to say that there might be a relationship between these two data sets. Certainly not 100%, but then again the same could easily be said of the relationship of temperature to Co2. The same type of inconsistencies the commenter points out in this correlation could easily be made for Co2 (e.g., why, if CO2 was increasing, and in fact accelerating, were temps in 1980 lower than 1940?The answer, of course, is that climate is complicated. But I see nothing in this chart that is inconsistent with the hypothesis that the sun might have been responsible for perhaps half of the 20th century warming. And if Co2 is left with credit for just 0.3-0.4C warming over the last century, it is a very tough road to get from this past warming to sensitivities as high as 3C or greater. I have all along contended that Co2 will likely drive 0.5-1.0C warming over the next century, and see nothing in this chart that makes me want to change that prediction.
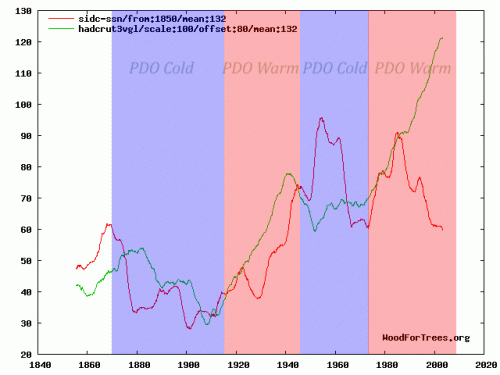
- I was playing around a bit more, and found adding in PDO cycles fairly interesting (really this should be some combined AMO/PDO metric, and the exact dates of PDO reversals can be argued about, but I was going for quick and dirty). Here is what I got:
If I wanted to make the same kind of observations as the commenter, I could say that temperature outpaced the sun during PDO warm phases and lagged the sun during cool phases, about what one would expect. Again, I firmly believe there is still a positive warming trend when you take out cycles like the PDO and effects of the sun and other such influences — but that trend, even if all due to CO2, appears to be far below catastrophic sensitivity levels.
- It is kind of ironic that the post was actually not an in-depth analysis of solar cycles, but merely a statement of a hypothesis that solar activity level rather than the trend in solar activity should be regressed against temperature changes. This seems like a fair hypothesis — one only has to think of a burner on a stove to understand it — but the commenter ignored it. In fact, the divergence she points to in the late 1990’s is really exactly to the point. Should a decreased solar output yield decreased temperatures? Or, if that output is still higher than a historical average, will it still drive temperatures higher? The answer likely boils down to how fast equilibrium is reached, and I don’t know the answer, nor do I think anyone else does either.
- I ask that people use their terms carefully. I am not a “denialist” if that is meant to mean that I deny any anthropogenic effects on temperature or climate. I am a denialist if that is meant to mean that I deny that warming from anthropogenic Co2 will cause catastrophic impacts that will outweigh the cost of Co2 abatement.
Updates: OK, I see that in the post in question, one of the quotes from another source used the word “morons.” For those not experienced with reading blogs, indented text is generally quoted material from another source. I guess I now understand the confusion — I stand by my statement, though, that I never use such terms in my own writing. It is not the style I try to adopt on this blog. Writers I quote have their own style, and my quoting them does not necesarily mean I totally agree with them, merely that the point they are making is somehow thought-provoking or one I want to comment on, extend, or rebut.


