
Despite Mann’s best efforts to make the Medieval warm period a Soviet-style un-event, the warm period, as well as the little ice age, seem to be making a comeback. Which makes sense, since after all Greenland was not named Glacierland by the Vikings and we have lots of nice stores about skating on Dutch canals and the Thames in these periods.
Yearly Archives: 2007
Declaring the Science Complete Before It Was Even Started
Many of us who hear the frequent phrase "the science is settled" understand that no such thing is true. We barely understand much, if anything, about climate. We have been studying it seriously, with modern tools like sattelites and historical proxies, for perhaps 30 years. From a historical perspective, no system as complex as science was cracked by man in as little as 30 years, but it is not unusual that people try to declare that the debate is over (The phlogiston theory of combustion is settled science!)
However, I found this article by Richard Lindzen in 1992 particularly fascinating. I don’t think any serious climate scientist today would say that we really understood much about climate in 1989. But that didn’t stop folks from calling it settled:
By early 1989, however, the popular media in Europe and the United States were declaring that "all scientists” agreed that warming was real and catastrophic in its potential.
…
In the meantime, the global warming circus was in full swing. Meetings were going on nonstop. One of the more striking of those meetings was hosted in the summer of 1989 by Robert Redford at his ranch in Sundance, Utah. Redford proclaimed that it was time to stop research and begin acting. I suppose that that was a reasonable suggestion for an actor to make, but it is also indicative of the overall attitude toward science. Barbara Streisand personally undertook to support the research of Michael Oppenheimer at the Environmental Defense Fund, although he is primarily an advocate and not a climatologist. Meryl Streep made an appeal on public television to stop warming. A bill was even prepared to guarantee Americans a stable climate.
Hat tip to Tom Nelson who is doing as good a job as any skeptic site of providing links to interesting articles every day. I hope he can keep up his early blistering pace.
Incredible Climate Resource
Courtesy of Tom Nelson comes a pointer to this incredible link-rich page of climate articles, mostly from a skeptical perspective.
Cooler but Poorer Gets You This
This is what we will continue to get by sharply reducing world economic growth, particularly growth in developping nations, to reduce CO2 by a few increments:
Military ships and helicopters were trying on Saturday to reach thousands of survivors of a super cyclone that killed more than 1,600 people and pummeled impoverished Bangladesh with mighty winds and waves.
Cyclone Sidr smashed into the country’s southern coastline late on Thursday night with 250 kph (155 mph) winds that whipped up a five meter tidal surge. It was the strongest cyclone since a 1991 storm that killed some 143,000 people in Bangladesh.
143,000 dead from a hurricane? This is not global warming, this is poverty. The death toll from the worst storm in the US in recent history was well under a hundred. Because even our poor are rich compared to the rest of the world.
The Hidden Message
The cost to abate CO2 production as much as climate catastrophists wish will be staggering. One of the ways the catastrophists and their supporters in the media work to cover up this fact is to publish numerous cute articles about families recycling and such. The hidden message is that this is all that it would take from us to make an impact on CO2.
This Sunday article in the Arizona Republic is a great example (last Sunday, the Republic had an article just mentioning, without letting us make our arguments, that skeptics like me exist in Phoenix. However, even this violates the orthodoxy so the Republic has had pro-catastrophist and green front page articles every day since as pennance.). In today’s article, the Republic looks at a number of families and gives advice on how they could be greener. Here is an example from the analysis of the Weinberger family:
WHAT THEY’RE DOING RIGHT: The family makes an effort to recycle. Brian Weinberger estimated that 20 to 40 percent of their recyclables make it into the recycling bin each week. They also avoid toxic pesticides and herbicides for their lawn and home. "We can never eradicate enough of these types of items," said Greg Peterson of the Urban Farm in Phoenix.
WHERE THEY CAN IMPROVE: With a little extra effort, the Weinbergers could boost their recycling rate to more than 80 percent, significantly reducing their weekly garbage. The family also buys a large amount of processed and packaged food, which consumes resources and creates more trash. When making purchasing decisions, Peterson suggests that the family only consider items packaged in recyclable materials, such as paper or glass.
First, they are dead wrong in their analysis of process an packaged foods. Also, recycling saves us almost no energy, but doesn’t it make us feel good. Here is another example for the Erickson family:
WHAT THEY’RE DOING RIGHT: "This family gives me great hope," Peterson said. "Their actions (are) making a significant difference." Jasper, 10, and Eliot, 7, bring their water bottles and utensils from their packed lunch back home from school each day for reuse. The family recycles nearly all the recyclable items they use. The kids use a blank side of Todd’s old office papers for drawing. Both parents bring their own bags to stores, buy secondhand furniture to avoid excess waste and try to buy organic meats and produce.
WHAT THEY COULD IMPROVE: Peterson suggests investing in a home solar system to reduce their reliance on conventional power supplies. He also recommends they take advantage of the free home-energy audit offered by their utility, Arizona Public Service. SRP offers a similar service.
Does the author sound like a priest talking about his congregation or what? "This family gives me great hope"? Barf. Well, I hope the Ericksons are really, really wealthy, because his recomendation to put in home solar is really expensive. Even with a 50% government subsidy and the best solar site in the world here in Phoenix, the numbers don’t even come close to working.
OK, Ericksons and Weinbergers, here is what you are really going to have to do. The catastrophists want you to cut your CO2 impact by 50-60%. Here, for example, is a climate bill proposed in Britain:
The Bill does not say how carbon dioxide emissions will be cut. However, it commits the Government to a 60 per cent reduction by 2050. One method could be personal carbon-allowances, where everyone is given a fixed amount of carbon to use each year.
Each time they travel in a plane, buy petrol, go shopping or eat out would be recorded on a plastic card. The more frugal could sell spare carbon to those who want to indulge themselves. But if you were to run out of your carbon allowance, you could be barred from flying or driving.
So here is the new plan for the Ericksons and Weinbergers, who have five and four kids respectively:
- Everything you buy requires fossil fuels to produce, so you may only have half as much. That means food for you and your kids too.
- In the next generation, no one is going to be having five and four kids. Certainly those green Europeans would never do something as damaging as having four or five kids. If you had aborted a few of the little darlings, just think how much CO2 you would have avoided?
- The article says all your kids play sports. OK, pick half of your kids, and tell them they don’t get to play sports any more. Gotta cut that driving in half. The good news is the other half of the kids can still play.
- Those vacations you took last summer, to escape the heat in Arizona, well cut them in half as well. That little play area in the mall makes a nice alternative to seeing Yellowstone, and all those tourists are just environmentally damaging Yellowstone anyway.
Actually, there may be an economic way to avoid all these cutbacks — The backyard nuclear reactor is carbon free!
New UN Climate Statement
Under mounting pressure from climate catastrophists to ignore uncertainties in the science and to produce definitive statements that can be used as calls for government interventionism, the UN will apparently release a new "warning" this week:
Global warming is destroying species, raising sea levels and threatening millions of poor people, the United Nations’ top scientific panel will say in a report today that U.N. officials hope will help mobilize the world to take tougher actions on climate change.
The report argues that only firm action, including putting a price on carbon-dioxide emissions, will avoid more catastrophic events.
Those actions will take a small part of the world’s economic growth and will be substantially less than the costs of doing nothing, the report says.
For the first time, the UN is trying to argue explicitly that the cost of CO2 abatement is lower than the cost of doing nothing. They are arguing that a cooler but poorer world is superior to a warmer and richer world. I am glad they are finally arguing this point. Because while we can argue about the truth of how much the world has warmed and how much is due to man, the UN is DEAD WRONG on this point. The cost of aggressive CO2 abatement is far, far higher than the cost of doing nothing.
The report presumably will be released by UN Secretary-General Ban Ki Moon, who demonstrated his stunning ignorance of climate science, geology, and geography on a recent climate-junket to Antarctica. Let’s take it line by line.
Is man destroying or threatening species? Absolutely. Is this threat from CO2 and warming? No, and I have read every inch of the UN IPCC report and you can find no evidence for this proposition. But saying this rallies the environmental base (the hard core environmentalists don’t really care about poor people, at least when their interests conflict with animals). Most of the evidence is that species thrive in warmer weather, and polar bears have survived several inter-glaciation periods where the north pole melted entirely in the summer.
Are sea levels rising? Yes. In fact, they have been rising for at least 150 years, and in fact have been rising steadily and at roughly the same rate since the last ice age. We have seen absolutely no acceleration of the underlying sea level rise trend. Further, the UN’s IPCC does have a forecast for sea level rise over the next century. Even using temperature forecasts I consider exaggerated, the UN does not forecast more than about a foot of sea level rise over the coming century, only a bit more than what the sea level has risen over the last 150 years. This is a great example of the disconnect between the UN political climate reports and the science underlying them. The guys writing the summary know that their report says only a few inches of sea level rise, so they just say it is rising, and then let the crazies like Al Gore throw around numbers like 20 feet.
Here is an interesting thought: If I say the sea levels will rise 0" over the next 100 years, the UN will call me out and say I am wrong. However, when Al Gore said sea levels will rise 20 feet in his movie An Inconvenient Truth, no one at the UN or the IPCC called him out, despite the fact that my forecast was only 12 inches different from theirs and his was 19 feet different.
And of course, there are the poor. The number one biggest losers in any effort to abate CO2 emissions will be the poor. In wealthy countries like the US, the poor will be the hardest hit by $10 or even $20 gas prices that would be necessary to rolling CO2 production back to 1990 levels. In the third world, nearly a billion people just starting to emerge from poverty will have no chance of doing so if their economies are hamstrung with CO2 limits. The poor will be devastated by aggressive CO2 limits.
Weighed against this economic disaster would be, what? How would rising world temperatures hurt the poor? Well, its not at all clear. A foot of sea-level rise is very unlikely to hurt many poor people, though it might inconvenience a few rich owners of beach-front luxury homes. Here is a clarifying question I often ask people — would you rather fifteen Atlantic hurricanes each year, or sixteen hurricanes each year and Carribbean economies that are twice as rich and therefore have twice the resources to handle hurricanes. This is the colder and poorer vs. warmer and richer choice.
It is often claimed that global warming will cause droughts, but in fact warmer world temperatures will vaporize more water in the atmosphere and should net increase rain, not drought. And many of the farmers in the northern hemisphere would enjoy longer growing seasons and thereby more food production.
Glaciers and ice caps are melting at a rapid rate; animals and plants are shifting their range to accommodate warmer air and water; and planting seasons are changing, the report said.
Yes ice is melting in the Northern Hemisphere. This is 15% of the world’s ice. 85% of the world’s ice is in Antarctica, which is increasing. Seriously. I know you don’t believe this if you trust the media, but the ice that is melting in Greenland is tiny compared to the ice that is increasing at the South Pole. In fact, the IPCC gets most of its prjected sea rise from thermal expansion of warmer oceans, not from ice melting. And don’t you love the "planting seasons are changing." That sounds like its scary, or something, until you recognize the truth is that planting seasons are changing, becoming longer and more beneficial to food production!
On many occasions, I have discussed the bad science that goes into these apocalyptic forecasts. But that science is of top quality compared to the economics that must have gone into the statement that:
The most stringent efforts to stabilize greenhouse gases would cost the world’s economies 0.12 percent of their average annual growth to 2050, the report estimates.
This is absolute, unmitigated crap. Though I have not seen specifics in this report, the UN’s position has generally been that emissions should be rolled back to 1990 levels (the target embodied in the Kyoto treaty). Such a target implies reductions of more than 20% from where we are today and well over 50% from where we will be in 2050. These are enormous cuts that cannot be achieved with current technology without massive reductions in economic growth. The world economy is inextricably tied to the burning of fossil fuels. And, unlike ancillary emissions like SO2, CO2 emissions cannot be limited without actually reducing carbon combustion since it is fundamental to the combustion chemistry. Even supporters of legislation such as the Bingaman-Specter bill admit that as much as a trillion dollars will need to be spent to reduce global temperatures about 0.13C. And that is a trillion for the first tenth of a degree — the law of diminishing returns means that each additional tenth will cost more.
Lets look at history as our guide. Most of the European countries and Japan signed onto the Kyoto Treaty to reduce emissions to 1990 levels. They have taken many expensive steps to do so, implemented many more controls than in the US, and have gas prices as much as double those in the US. During the period since 1990, most of these countries, unlike the US and China and India, have been in a deep and extended economic recession, which tends to suppress the growth of fossil fuel consumption. Also, the CO2 numbers for countries like Russia and Germany benefit greatly from the fall of the old Communist Block, as their 1990 base year CO2 numbers include many horribly inefficient and polluting Soviet industries that have since been shut down. And, given all this, they STILL are going to miss their numbers. These countries have experienced reductions in economic growth orders of magnitude greater than this 0.12 percent quoted by the UN, and that still is not enough to reduce CO2 to target levels. Only outright contraction of the world’s economy is going to suffice [note: A strong commitment to replacing coal plants with nuclear might be a partial solution, but it will never happen because the people calling for CO2 controls are the same ones who shut down our nuclear programs. Also, technological change is always possible. It would be awesome if someone found a way to roll out sheets of efficient solar cells like carpet out of Dalton, Georgia, but that has not happened yet.]
The UN has gotten to such low cost estimates for their government controls because they have convinced themselves, much like the promoters of building football stadiums for billionaire team owners, that they will get a huge return from the government CO2 controls:
"There is high agreement and much evidence that mitigation actions can result in near-term co-benefits, for example improved health due to reduced air pollution, that may offset a substantial fraction of mitigation costs," said the report, which summarizes research over five years of more than 2,000 of the world’s top climate-change scientists…
The U.N. panel embraced the arguments of British economist Nicholas Stern, who concluded last year that the cost of taking tough measures to curb pollution will be repaid in the long run.
Nicholas Stern? Haven’t we heard that name before. Why, yes we have. He is the man that said that all of the world’s climate problems would go away if we forced all the western economies to look just like India.
Mr Stern, the former chief economist of the World Bank, sends out a very clear message: “We need to cut down the total amount of carbon emissions by half by 2050.” At current levels, the per capita global emissions stand at 7 tonnes, or a total of 40-45 gigatonnes. At this rate, global temperatures could rise by 2.5-3 degrees by then. But to reduce the per capita emissions by half in 2050, most countries would have to be carbon neutral. For instance, the US currently has, at 20-25 tonnes, per capita emissions levels that are three times the global average.
The European Union’s emission levels stand at 10-15 tonnes per capita. China is at about 3-4 tonnes per capita and India, at 1 tonne per capita, is the only large-sized economy that is below the desired carbon emission levels of 2050. “India should keep it that way and insist that the rich countries pay their share of the burden in reducing emissions,” says Mr Stern.
Which, by the way, is exactly my point. I very much hope Mr. Stern continues to make this clear in public. One of the ways catastrophists support their cause of massive government interventionism is to try to portray the answer as little cutsie actions, like your 5-year-old helping with the recycling. This is not what is require to meet these targets. What is required is ratchet down the US economy until we are all about as wealthy as the average Indian. I guess that would at least take care of the outsourcing "problem."
One of the ways that the UN gets away with this is that no one has the time to read the detailed scientific report, and so reporters rely on the summaries like these. Unfortunately, the same people who write the scientific sections are not the people who write the summaries. Careful language about uncertainties, which are still huge, in the science are replaced by summaries written by politicians that say:
The near-final draft, approved Friday by representatives of more than 140 governments meeting in Valencia, Spain, said global warming is "unequivocal" and said man’s actions are heading toward "abrupt or irreversible climate changes and impacts."…
"This will be viewed by all as a definitive report. It is the blueprint for the Bali talks," said Sen. John Kerry, D-Mass., who will be at the Indonesian U.N. meeting beginning Dec. 3 as part of a U.S. senatorial delegation.
Another technique used by the UN that we see in play here is their willingness to cherry-pick one author that follows the UN narrative to refute a whole body of science that is contrary to the narrative. Thus, the UN latched onto Michael Mann’s hockey stick to overturn a consensus that there was a Medieval warm period, and now they have latched onto Nicholas Stern to overturn the opinion of, approximately, every other economist in the world who think CO2 mitigation will be really expensive.
As always, you are encourage to view my movie What is Normal: A Critique of Catastrophic Man-Made Global Warming Theory or check out my book (free online) called A Skeptical Layman’s Guide to Anthropogenic Global Warming.
Reality Checking the Forecasts
At the core of my climate video is a reality check on catastrophic warming forecasts, which demonstrates, as summarized in this post, that warming over the next century can’t be much more than a degree if one takes history as a guide. The Reference Frame has a nice summary:
Well, we will probably surpass 560 ppm of CO2. Even if you believe that the greenhouse effect is responsible for all long-term warming, we have already realized something like 1/2 (40-75%, depending on the details of your calculation) of the greenhouse effect attributed to the CO2 doubling from 280 ppm to 560 ppm. It has led to 0.6°C of warming. It is not a hard calculation that the other half is thus expected to lead to an additional 0.6°C of warming between today and 2100.
Other derivations based on data that I consider rationally justified lead to numbers between 0.3°C and 1.4°C for the warming between 2000 and 2100. Clearly, one needs to know some science here. Laymen who are just interested in this debate but don’t study the numbers by technical methods are likely to offer nothing else than random guesses and prejudices, regardless of their "ideological" affiliation in the climate debate.
A Critique of the IPCC
Via Tom Nelson, a in-depth critique of the UN IPCC climate assessment process.
What is Normal?
It seems that 29 years of satellite observation may in fact not be enough to fully understand climate cycles that can last tens, hundreds, or thousands of years:
A team of NASA and university scientists has detected an ongoing reversal in Arctic Ocean circulation triggered by atmospheric circulation changes that vary on decade-long time scales. The results suggest not all the large changes seen in Arctic climate in recent years are a result of long-term trend…
"Our study confirms many changes seen in upper Arctic Ocean circulation in the 1990s were mostly decadal in nature, rather than trends caused by global warming," said Morison….
The Arctic Oscillation was fairly stable until about 1970, but then varied on more or less decadal time scales, with signs of an underlying upward trend, until the late 1990s, when it again stabilized. During its strong counterclockwise phase in the 1990s, the Arctic environment changed markedly, with the upper Arctic Ocean undergoing major changes that persisted into this century. Many scientists viewed the changes as evidence of an ongoing climate shift, raising concerns about the effects of global warming on the Arctic.
Yes, the Artic is a degree or two warmer (it has for various reasons, understood and not yet understood) experienced the most warming worldwide. In contrast, the southern hemisphere, and particularly the Antarctic, have not really warmed at all, and have seen all time highs in ice.
HT to Bruce Hall. For this reason and many more, I titled my climate video "What is Normal?" By the way, the video is over 2000 views on Google video and YouTube, and over 600 people have downloaded the movie.
My Cause is More Important Than Your Cause
Al Gore, Via Rolling Stone and Tom Nelson:
"It is a mistake to think of the Climate Crisis as one in a list of issues that will define our future. It is the issue. Everything else must be viewed through that lens."
Anthony Watts With Another Valuable Study
One of the oddities about climate science is just how hard it is to get research that actually goes out and gathers new empirical data. Every climate scientist seems firmly rooted in the office tweaking their computer models, perhaps as an over-reaction to meteorology being historically mostly an observational science. Whatever the reason, study after study masticates the same old 30 or 40 historical proxies, or tries to devine new information out of existing surface temperature records. If you ever read Isaac Asimov’s book Foundation, you might remember a similar episode where a character is amazed that scientists no longer seek out new empirical data, but just manipulate data from previous studies.
The issue of how much urban heat islands bias surface temperature records is a case in point. The two most prominent studies cited by the IPCC and the RealClimate.org folks to "prove" that urban heat islands don’t really exist are Peterson and Parker. Parker in particular really bent over backwards to draw conclusions without actually gathering any new data:
One of the main IPCC creeds is that the urban heat island effect has a negligible impact on large-scale averages such as CRU or GISS. The obvious way of proving this would seem to be taking measurements on an urban transect and showing that there is no urban heat island. Of course, Jones and his associates can’t do that because such transects always show a substantial urban heat island. So they have to resort to indirect methods to provide evidence of “things unseen”, such as Jones et al 1990, which we’ve discussed in the past.
The newest entry in the theological literature is Parker (2004, 2006), who, once again, does not show the absence of an urban heat island by direct measurements, but purports to show the absence of an effect on large-scale averages by showing that the temperature trends on calm days is comparable to that on windy days. My first reaction to this, and I’m sure that others had the same reaction was: well, so what? Why would anyone interpret that as evidence one way or the other on UHI?
I have always wondered, why can’t someone just go out and measure? It can’t be that expensive to send a bunch of grad students out with identical calibrated temperature instruments and simultaneously measure temperatures both inside and outside of a city. At the same time, one could test temperatures on natural terrain vs. temperatures on asphalt. A lot of really good data that would be critical to better correction of surface temperature records could be gathered fairly cheaply.
Well, no one is doing it, so it is left to an amateur, Anthony Watts, to do it on his own time. Watts is the same person who, in frustration that the government bodies who maintained the surface historical temperature network kept no good information on instrument siting, set up a data base and a volunteer effort to fill the gap. The project continues to go well and grow at SurfaceStations.org, but it could still use your help.
Anyway, here is what Anthony is doing:
My experiment plan is this; by simultaneously logging temperature data and GPS readings on my laptop, I’ll be able the create a transect line. The Gill shield has a custom window clip which allows me to mount on the passenger window. The shield will be “aspirated” by driving. Should I have to stop for a signal. the GPS data will indicate a pause, and any temp data from that spot due to heat from the vehicle or others nearby can be excluded.
The temperature sensor and A/D converter for it both have NIST calibration, making them far better than the accuracy of an MMTS, but with the same resolution, 0.1°F.
The reason for the setup now is that I’m heading to Indianapolis next week, which was one of the cities presented in a study at Pielke’s conference. Plus that, Indianapolis is nearly perfectly flat and has transect roads that match the cardinal compass points.
According to Parker 2006, “The main impact of any urban warming is expected to be on Tmin on calm nights (Johnson et al. 1991)” so that’s what I’ll be testing. Hopefully the weather will cooperate.
Unfortunately, this need for amateurs to actually gather empirical data because the climate scientists are all huddled around the computer screen is not unique in this case. One of the issues with proxy data like tree rings, which are used to infer past temperatures, is that past proxy studies are not getting updated over time. Over the last several decades, proxy measures of temperatures have diverged from actual temperatures, raising the specter that these proxies may not actually do a very good job of reporting temperatures. To confirm this, climate scientists really need to update these proxy studies, but they have so far resisted. In part, they just don’t want to expend the effort, and in part I think they are afraid the data they get will cause them to have to reevaluate their past findings.
So, Steve McIntyre, another amateur famous for his statistical criticisms of the Mann Hockey Stick, went and did it himself.
Podcast of My Interview on Climate Now Available
The podcast audio of Duane Lester’s interview of yours truly about climate issues is now up here. You can decide for yourself if this is true.
Anatomy of a False Panic
OK, here is a great example of the media blithely accepting panicky catsrophism where none is warranted (Link HT to Maggies Farm)
Scientists welcomed Ban Ki Moon to Antarctica with a glass of Johnny Walker Black Label served “on the rocks” with 40,000-year-old polar ice. But the researchers delivered an alarming message to the UN Secretary-General about a potential environmental catastrophe that could raise sea levels by six metres if an ice sheet covering a fifth of the continent crumbles.
The polar experts, studying the effects of global warming on the icy continent that is devoted to science, fear a repeat of the 2002 collapse of the Larsen B ice shelf. The 12,000-year-old shelf was 220 metres (720ft) thick and almost the size of Yorkshire.
“I was told by scientists that the entire Western Antarctica is now floating. That is a fifth of the continent. If it broke up, sea levels may rise as much as six metres,” Mr Ban said after being briefed at the Chilean, Uruguayan and South Korean bases during a day trip to King George Island, at the tip of the Antarctic Peninsula. …
Eduardo Frei Montalva Air Force Base, a year-round settlement of corrugated-iron cabins belonging to Chile, lies in one of the world’s worst “hot spots” – temperatures have been rising 0.5C (0.9F) a decade since the 1940s.
I don’t even know where to start with this. So I will just fire off some bullets:
-
Over the last 30 years, satellites have found absolutely no warming trend in Antarctica (from UAH via Steven Milloy):

- The tail is measuring the dog. The Korean station couldn’t possibly be more irrelevent to measuring Antarctic temperatures. It is on an island labelled 26-34 north of the tip of the Antarctic Penninsula. This is a bit like measuring Colorado temperatures from Hawaii:

-
It is well known that the Antarctic Penninsula, representing 2% of Antactica’s area, is warming while the other 98% is cooling. I discussed this more here. Al Gore took the same disingenuous step in his movie of showing only the anomolous 2%. The Antarctic Penninsula in the first graph below shows warming. The rest of Antarctica shows none (click to enlarge)


-
The IPCC predicts that with global warming, the Antarctic penninsula will see net melting while the rest of Antarctica will see net increases in ice. The penninsula is affected more by the changing temperatures of sea currents in the surrounding seas than in global climate effects. For most of Antarctica, temperatures will never concieveably warm enough to melt the ice sheets, since it is so cold even in the summer, and ice sheets are expected to expand as warming increases precipitation on the continent.
-
Scientists studying Antarctica have been there at most a few decades. We know almost nothing about it or its histroy. We certainly don’t know enough about "what is normal" to have any clue if activities on the Larson B ice shelf are anomolous or not.
-
The UN Sec-gen said that this ice shelf represented a fifth of the continent. Here, in actuality, is the Larsen ice shelf. The red box below greatly exaggerates Larsen’s size, and Larsen-B is only a portion of the entire Larsen shelf.

- The statement that the entire Western Antarctic is floating is just absurd. God knows what that is supposed to mean, but even if we ignore the word "floating", we can see from the map above we aren’t even talking about a significant portion of the Antarctic Pennninsula, much less of Western Antarctica. Here are actual pictures of the 2002 event. (by the way, if ice is really "floating", presumably in sea water, then it’s melting will have zero effect on ocean levels)
- Such a feared collapse already happened 5 years ago, and sea levels did not budge. But the next time it happens, sea levels are going to rise 20 feet?? Even the UN’s IPCC does not think sea levels will rise more than 8-12 inches in the next century due to their overblown temperature forecasts.
As always, you can consult my my book and my movie (both free online) for more details on all these topics.
Podcast Tonight
I will be on the All American Blogger podcast tonight, live here at 10PM, or of course any time after that through miracle of MP3 here. Never tried this format before with call-in questions and stuff, so it should be interesting. I will be discussing climate and catastrophic man-made global warming theory.
Arizona Republic Hit Piece on Skeptics
My kids woke me up at 7:00 this morning (Yuk!) to tell me I was on the front page of the Arizona Republic. I was quoted a couple of times in an article on climate change skeptics. I have a couple of thoughts about an article that really has me depressed today. If you want to know what I really think about climate, see my book and in my movie (both free online).
- After interviews, I am always surprised at what the writers chose to quote, and this article is no exception.
- I spent most of the article trying to explain this simple data exercise, but I guess newspapers today are science-phobic and would rather write he-said-she-said articles than actually get into the numbers. Unfortunately, the article leaves the impressions that we skeptics have problems with catastrophic global warming theory "just because."
- The article is not about the skeptics’ position, because it is not really stated. In fact, more space is spent on refuting skeptics than is even given to skeptics themselves. Here is the best test: The skeptic’s position would have been better served by not publishing this mess at all.
- Almost my entire discussion with the reporter was about the forecasts. I said man is causing some warming, but there are simple tests to show it likely won’t be catastrophic. I even said that it was the catastrophists tactic not to argue this point, but to shift the debate to whether warming exists at all, where they have a much stronger argument. Despite this whole discussion with the reporter, the reporter allowed the catastrophists to shift the debate again. They want to argue whether things are warmer, where they are on strong ground, and not about how much it will warming the future and whether this will justify massive government intervention, where they are on weak ground.
This article really frustrates me, and may pretty much spell the end for my ever giving an interview on the subject again (I will do a podcast on Monday, which I will link soon, but that is different because they can’t edit me). Despite it being an article about skeptics, the catastrophists are the only one that get any empirical evidence whatsoever into the article (however lame it may be). This really ticked me off in particular: I spent an hour giving specific empirical reasons why there were problems with forecasts and the theory. The reporter then just printed a few quotes from me that made me look like an uninformed idiot, saying "just because." Then they print this:
"There is clearly a group of thought that says because we’re not seeing debate now, it never happened in the scientific community," Huxman said. "That is simply wrong. It did happen, and it’s over. The debate now is over the idiosyncrasies, the internal workings."
Incredibly, they also credulously reprint the absurd Newsweek ad hominem attacks on skeptics.
What also got my attention was the companion article on an ASU professor who is a climate skeptic. Incredibly, in the whole article, not one sentence is dedicated to explaining why the professor is a skeptic. What is the empirical evidence he relies on, or the analysis he finds most compelling? We never find out. All we get is an article on dueling motivations. For example, the Republic writes:
Despite his notoriety as a hero of the skeptic crowd, Balling’s research and lifestyle contain some surprising contradictions.
He is in charge of climate studies at the Decision Center for a Desert City, an ambitious ASU program that looks at how drought will affect the Valley.
He’s a registered independent and lives a lifestyle that the hardiest environmental activist would recognize as green….
If there was a competition for living green, "put the cards on the table, and I’ll beat 99 percent of the faculty here," Balling said.
He avoids driving and doesn’t own a cellphone.
He would even have liked to see Al Gore win the presidency in 2000.
So? Why is this surprising? Should we all naturally expect that skeptics all eat children for dinner? And, of course, an article on a leading skeptic would not be complete without this:
Critics have assailed Balling’s ties to industries.
Balling received more than $679,000 in research funding from fossil-fuel-industry organizations between 1989 and 2002, according to figures provided by ASU. He served as a scientific adviser to the Greening Earth Society, a public-relations organization founded by the Western Fuels Association to promote the benefits of global warming.
Uh, OK. Here is a Coyote Blog challenge: Find me one article in a mainstream newspaper or news weekly that even once checks the sources of funding for climate catastrophists. This focus on funding and motivation and political affiliation for skeptics only is scandalously asymmetric. But take a quick look at the article – 85% of it is related to motivation, either how good his green credentials are or how much money he gets from oil companies – and not any discussion of what he actually thinks.
This final bit is especially funny. Think of all the wacko professors out there that are warmly accepted by their universities and the academic community. We’re talking about folks all the way up to and including men who have gone to prison for torturing and murdering women. But apparently having a climate skeptic on the faculty is just too much:
But his climate work has garnered the most national attention, which bothers some colleagues at ASU.
"For ASU, having Balling as such a prominent figure in the climate debate has been awkward, not so much because of his positions but because we have lacked scientists of similar stature whose work supports more widely held, opposing views," Jonathan Fink, director of ASU’s Global Institute of Sustainability, wrote in an e-mail. "Hence we have been viewed as somewhat of a fringe institution in the world of climate-change research."
Wow, its terrible to see such ill-repute brought to America’s #1 Party School. And by the way, what the hell kind of strategy is this? We want to make a name for ourselves in climate research, so to do so we think we should be just like all the other schools — that’s the way to differentiate ourselves!
I will post links to my podcast that is coming up Monday night. After that, I am not sure. I am pretty depressed about the state of the media on this issue. I have a lot of interests and more than enough to do with my time that I may take a break from climate for a while.
Looks Like I Was Right
A few days ago, I wrote this about a recent academic hoax:
I have therefore come to the conclusion that this hoax is likely the work of global warming catastrophists. My guess is that they wanted to make a point that skeptics were no such thing — that skeptics would bite like a hungry bass at such a lure as long as it supported their position. And certain folks in political circles did so, at least for a few hours. My presumption is that if we had all trumpeted this fake study, then our judgement on other issues would get called into question. My sense is that catastrophists have convinced themselves with their own propaganda that skeptics are all motivated by political and financial agendas. But most skeptics are really interested in the science, and are motivated by the real fear that we are at the cusp of embarking on some really poor, near tragic, policy decisions.
Apparently, via ICECAP and Roy Spencer, this guess was correct:
An anonymous Brit has now admitted in a brief interview that he wrote the fake global warming research paper which is claimed to have fooled some of us “global warming skeptics”. His stated purpose was to “expose the credulity and scientific illiteracy of many of the people who call themselves climate sceptics”.
I would argue that he has done just the opposite. Several of us (scientists and non-scientists alike) were able, within a matter of seconds to minutes, to identify the paper as a fake. We then spread the word, warning others of the hoax. Therefore, we showed that we do not, as the hoaxer claims, “believe almost anything if it lends support to their position”. We did exactly the opposite.
Remember how I ended the original post:
Now, if you really want to have fun, create a similar hoax the other way, supporting catastrophic man-made global warming. You will probably make the NBC Nightly News. It would be fun to try something really nutty and see if people buy it, like saying the oceans will rise 20 feet in the next century… oops, its already been done. Al Gore made that claim, among other truly absurd statements, in his movie An Inconvinient Trust, for which he not only made the NBC Nightly News but he also won an Oscar and a Nobel Prize.
The Splice
To some extent, 1000-year temperature histories are moderately irrelevent to modern global warming discussions. In fact, it is fairly amazing that the evidence of tree rings and such over 1000 years is discussed more than the instrumental record of the last 100, which tends to undercut most catastrophic warming forecasts. However, catastrophists have attempted to use these past temperature reconstructions to make the argument that temperatures were incredibly stable and low right up to the point that man has made them higher and less stable in the last 100 years. For this reason it is worth discussing them, if only to refute this conclusion.
I won’t go into a lengthy discussion of historical reconstructions, as I alread have in my book and in my movie (both free online). In this post I just want to talk about one issue: the splice.
Below is the 1000-year temperature reconstruction (from proxies like tree rings and ice cores) in the Fourth IPCC Assessment. It shows the results of twelve different studies, one of which is the Mann study famously named "the hockey stick."

Among many issues, I pointed out the fact that this chart appends or splices the black line, actual measured temepratures, onto the colored lines, which are the historical temperature reconstructions from proxies.

I made the point that this offended by scientific training: When one gets an inflection point right at the place where two data sources are spliced, as is the case here, one should be suspicious that maybe the inflection is an artifact of mismatches in the data sources, and not representative of a natural phenomenon. And, in fact, when one removes the black line from measured temperatures and looks at only proxies, the hockey stick shape goes away:

The other day I discovered that this inflection point is a fairly old criticism (no surprise, I never claim to be original). Old enough, in fact, that Michael Mann and the folks at realclimate.org have fired back:
No researchers in this field have ever, to our knowledge, "grafted the thermometer record onto" any reconstruction. It is somewhat disappointing to find this specious claim (which we usually find originating from industry-funded climate disinformation websites) appearing in this forum.
The guys at realclimate are just so cute with the "industry-funded climate disinformation" attack — they remind me of the Soviets and how they used to blame everything on CIA plots. I can say that 1) I recognized this problem on my very own after about 20 seconds of looking at the graph and 2) I have yet to recieve my check from the industry cabal.
It turns out, however, that this is wildly disingenuous. What they mean is that none of the colored lines include gauge measures grafted onto older proxy data. But I never really accused them of that. Interestingly, Steve McIntyre argues that even this claim is wrong, and some of the colored lines do include spliced-on gauge measures.
But my point, which Mann has never refuted or addressed, is that whether the proxy lines themselves include grafted data or not, the proxy lines are NEVER shown to the public or to policy makers without the gauge temperature line added to the chart. Have you ever seen the proxy lines as they are in my third chart above without the 20th century gauge temperature line? If in policy discussions and media reports, this gauge temperature line is always included on the graphs in a way that it looks like an extention of the proxy series, then effectively they are grafting the data sets together in every discussion that really matters.
By the way, it is fairly easy to demonstrate that the proxy studies and the gauge temperature measurements do not represent consistent and therefore mergeable data sets. Over hundreds of years, we have developped a lot of confidence that the linear thermal expansion of mercury in a glass tube is a good proxy for temperatures. We have not, however, developped similar confidence in bristle cone pine tree rings, whose thickness can be influenced by everything from soil and atmospheric composition to precipitation. Lets look at a closeup of the graph above:

You can see that almost all of the proxy data we have in the 20th century is actually undershooting gauge temperature measurements. Scientists call this problem divergence, but even this is self-serving. It implies that the proxies have accurately tracked temperatures but are suddenly diverting for some reason this century. What is in fact happening are two effects:
-
Gauge temperature measurements are probably reading a bit high, due to a number of effects including urban biases
-
Temperature proxies, even considering point 1, are very likely under-reporting historic variation. This means that the picture they are painting of past temperature stability is probably a false one.
All of this just confirms that we cannot trust any conclusions we draw from grafting these two data sets together.
By the way, here is a little lesson about the integrity of climate science. See that light blue line? Here, let’s highlight it:

For some reason, the study’s author cut the data off around 1950. Is that where his proxy ended? No, in fact he had decades of proxy data left. However, his proxy data turned sharply downwards in 1950. Since this did not tell the story he wanted to tell, he hid the offending data by cutting off the line, choosing to conceal the problem rather than have an open scientific discussion about it.
The study’s author? Keith Briffa, who the IPCC named to lead this section of their Fourth Assessment.
More discussion on this topic can be found in my book and in my movie (both free online).
The State of Climate Science
No matter whether we agree with the conclusions of climate scientists or not, this kind of thing should worry everyone:
The idea that there would be inconsistent versions of something from Lonnie Thompson is not something that will surprise previous readers. Here is a collation of different “grey” versions of one of the components in the above graphic (Dunde). Dunde was drilled in 1987 and is a staple of multiproxy studies. It has about 3000 samples containing not just dO18 values but relevant dust and chemistry information. Thompson has refused to archive original sample data. I’ve made many efforts to get this data but have been rebuffed by Thompson himself, the National Science Foundation, Science magazine and the National Academy of Sciences (both in their capacity as publishers of PNAS and in their capacity as organizers of the Surface Temperatures panel). This is important data which cannot be duplicated by third parties – Thompson has an obligation to archive all sample information and NSF and the journals have an obligation to require him to archive it: none of them are living up to these obligations. Maybe Al Gore could ask him.
The results of different Thompson versions of Dunde make a spaghetti graph all by themselves. Note that one version with annual data ends at a very low value. This inconsistency is not isolated to Dunde – as you can see from perusing the posts in the Thompson category.
Dunde Versions. Heavy black – Yao et al 2006 (3 year rolling average); thin black – MBH98 (annual); red – PNAS 2006 (5-year averages); blue – Clim Chg 2003 (10-year averages); purple – Yang et al 2002 (values in 50 -year intervals); green – Crowley and Lowery 2000 (original in standardized format, re-fitted here for display by regression fit to MBH98).

What you see is a climate scientist who refuses to release a critical experimental / observational data set to the broader community, while at various times releasing what appear to be wildly different versions of the data.
And this is frightening as well:
In 2003, Thompson took a new ice core at Bona Churchill. We haven’t heard anything about it. On previous occasions, e.g. here , I’ve predicted that 20th century values at this site would be lower than 19th century values – using the mining promotion philosophy that if Thompson had had “good” results, we’d have heard about them. The prediction has a little more teeth than that as dO18 values at nearby Mount Logan obtained and already published by Fisher et al went down in the 20th century.
Here, we see that Steve McIntyre is able to make reliable predictions of a climate scientist’s actions using the simple prediction heuristic "if the study does not end up getting published, it means that the results did not support the catastrophic man-made global warming proposition." Call it, I gues, the Inconvinient experimental results.
Oh, and by the way — Thomson was the source of many of the temperature reconstructions, including the "hockey stick," shown by Gore in An Inconvinient Truth.
Single Best Reason Not to Panic About Climate
When I have only 60 seconds to explain why I dont think man-made global warming will be catastrophic enough to warrant massively expensive CO2 abatement programs, this is my argument:
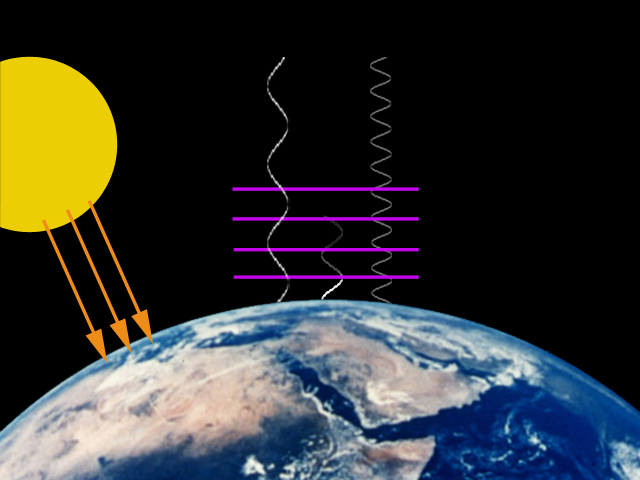
- CO2 does indeed absorb selected wavelengths of readiation returning to space from earth, having a warming effect on the atmosphere. However, this effect is a diminishing return — each successive increment of CO2 concentrations will have a much smaller effect on temperatures than the previous increment. Eventually, CO2 becomes nearly saturated in its ability to absorb radiation. The effect is much like painting a red room with white paint. The first coat covers a lot of red but some still shows through. Each additional coat will make the room progressively whiter, but each successive coat will have a less noticeable effects than the previous coat, until the room is just white and can’t get any whiter (the "layers" of CO2 are shown in pink below)
- In the 20th century, the UN IPCC claims Earth’s surface temperatures have increased by about a 0.6 degree Celsius (though there are some good reasons to think that biases in the installation of temperature instruments have exaggerated this apparent increase). To be simple (and generous), let’s assume all this 0.6C increase is due to man-made greenhouse gasses. Some may in fact have been due to natural effects, but some may also have been masked by man-made sulfate aerosols, so lets just call man-made warming to be 0.6C.
- Since the beginning of the industrial revolution, it is thought that man has increased atmospheric CO2 concentrations from 0.028% of the atmosphere to 0.038% of the atmosphere. Since scientists often talk about the effect of a doubling of CO2, this historic rise in CO2 is 36% of a doubling.
- Using simple math, we see that if temperatures have risen 0.6C due to 36% of a doubling, we might expect them to rise by 1.67C for a full doubling to 0.056% of the atmosphere. But this assumes that the rise is linear — and we already said (and no one denies) that it is in fact a diminishing return relationship. Using a truer form of the curve, a 0.6C historic rise for 36% of a doubling implies a full doubling would raise temperatures by about 1.2C, or about 0.6C more than we have seen to date (see chart below). This means that the magnitude of global warming in the next century might be about what we have seen (and apparently survived) since 1900.
- Obviously, there is some kind of disconnect here. The IPCC predicts temperature increases in the next century of 4-8 degrees C. Big difference. In fact, the IPCC predicts we will get a 0.5C rise in just 20 years, not 70-100. Whereas we derived a climate sensitivity of 1.2 from empirical data, they arrive at numbers between 3 and 4 or even higher for sensitivity. The chart below shows that to believe sensitivity is 3, we would have to have seen temperature rises due to man historically of 1.5C, which nobody believes.
So how do they get accelerating temperatures from what they admit to be a diminishing return relation between CO2 concentration and temperature? And for which there is no empirical evidence? Answer: Positive feedback.
- Almost every process you can think of in nature operates by negative feedback. Roll a ball, and eventually friction and wind resistance bring it to a stop. Negative feedback is a ball in the bottom of a bowl; positive feedback is a ball perched precariously at the time of a mountain. Positive feedback breeds instability, and processes that operate by positive feedback are dangerous, and usually end up in extreme states — these processes tend to "run away" like the ball rolling down the hill. Nuclear fission, for example, is a positive feedback process. We should be happy there are not more positive feedback processes on our planet. Current man-made global warming theory, however, asserts that our climate is dominated by positive feedback. The IPCC posits that a small increase in temperature from CO2 is multiplied 2,3,4 times or more by positive feedbacks like humidity and ice albedo.
- There are three problems with these assumptions about positive feedback. One, there is no empirical evidence at all that positive feedbacks in climate dominate negative feedbacks. The 20th century temperature numbers we discussed above show no evidence of these feedbacks. Since we used empirical numbers to calculate the sensitivity, it is already net of any feedbacks. Two, the long-term temperature record demonstrates that positive feedbacks can’t dominate, because past increases in temperature and CO2 have not run away. And three, characterizations of stable natural processes as being dominated by positive feedback should offend the intuition and common sense of any scientist.
- An expected 21st century increase of 0.5 or even 1 degree C does not justify the massive imposed government interventions that will be costly both in dollars and lost freedoms. In particular, the developing world will be far better off hotter by a degree and richer than it would be cooler and poorer. This is particularly true since sources like an Inconvenient Truth wildly exaggerate the negative effects of global warming. There is no evidence tornadoes or hurricanes or disease or extinction are increasing as the world warms, and man-made warming advocates generally ignore any potential positive effects of warming. As to rising sea levels, the IPCC predicts only a foot and a half of sea level rise even with 4 or more degrees of warming. Sea level rise from a half to one degree of warming would be measured at most in inches.


OK, so that was more than 60 seconds. But it is a lot less than 80 pages. There is a lot of complexity behind every one of these statements. If you are intrigued, or at least before you accuse me of missing something critical, see my longer paper on global warming skepticism first, where all these issues and much more (yes, including tree rings and cosmic rays) are discussed in more depth. You can also watch my free climate movie.