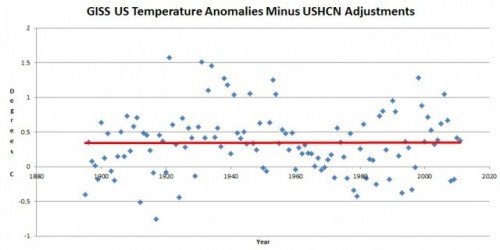
Way back, I had a number of posts on surface temperature adjustments that seemed to artificially add warming to the historical record, here for example. Looking at the adjustments, it seemed odd that they implied improving station location quality and reduced warming bias in the measurements, despite Anthony Watts work calling both assumptions into question.
More recently, Steve Goddard has been on a roll, looking at GISS adjustments in the US. He’s found that the essentially flat raw temperature data:
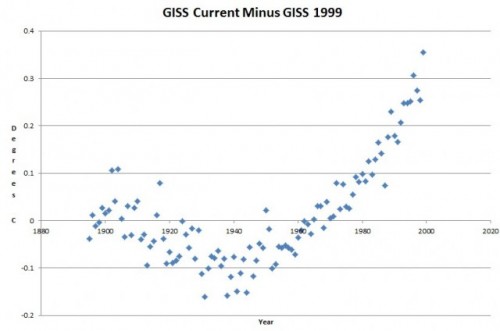
Has been adjusted upwards substantially to show a warming trend that is not in the raw data. The interesting part is that most of this adjustment has been added in the last few years. As recently as 1999, the GISS’s own numbers looked close to those above. Goddard backs into the adjustments the GISS has made in the last few years:
So, supposedly, some phenomenon has that shape. After all, surely the addition of this little hockey stick shaped data curve to the raw data is not arbitrary simply to get the answer they want, the additions have to represent the results of some heretofore unaccounted-for bias in the raw data. So what is it? What bias or changing bias has this shape?


an exaample of changing data to simulate warming.
http://wattsupwiththat.com/2008/11/14/the-evolution-of-the-giss-temperature-product/
The adjustments seem to be inverse of the station drop off: a function of where the stations are?
Now that I’m thinking: we understand that the remaining stations are weighted towards lower altitudes nearer the oceans, and more urban than rural. Wouldn’t this mean that the adjustments would have to REDUCE measured temperatures?
Do it yourself. A B C D of Hockey stick in the making.
There is an interesting story on Hufpost about doom and gloom in the Antarctic.
After doing a little research I came to the following conclusions.
After reading this story and doing a little research I am convinced there is no reason to worry about Antarctica!
1) Surface-stations show no warming in 40 years.
For example http://data.giss.nasa.gov/cgi-bin/gistemp/gistemp_station.py?id=700895320000&data_set=14&num_neighbors=1
2) Sea ice is where it was in 1970 which is very high.
3) Land ice is probably loosing a cm or two a year but the base is kilometers thick so who cares ? In a thousand years we can check again !
Hufpost is the tabloid for alarmists. Made-up stories of global warming keep this paper afloat.
Alarmists gobble them up like popcorn !
The point of the article was to say the Antarctic was in crisis.
Sea Ice was at 1970’s level but the land ice is apparently melting by a cm or 2 a year.
Since the land is covered by several Km of ice we can worry about this in ten thousand years.
The remainder of the article was a guess about future warming which was just that.
No basis just guessing.
It was sloppy journalism at its finest.
The skeptics ripped it to pieces.
Here is the link
http://www.huffingtonpost.com/2012/07/12/environmental-threats-antarctica_n_1669023.html?utm_hp_ref=climate-change
It’s primarily called confirmation bias.
This from twitter:
@ScotClimate: Scottish Government found to have lied on key figure. Is the Scottish Climate Bill dead?. Will the minister resign? http://bit.ly/OwkVl1
The Scottish government lied to politicians about key financial data which was central to the argument for the bill when they passed the Scottish Climate Change Bill. The government citing Stern said that the economic cost of a 2-3°C rise would be “between 5-20% of GDP”. In fact Stern suggests there may not be any net economic harm quoting figures of 0-3%
The figures are so key to justifying the bill, that it really is difficult to see how this bill could withstand a legal challenge.
… but the scandal gets worse. The Scottish paper (The Courier) which broke this story seems to have been lent on to remove the story. Presumably by someone in government.
This is about as bad as we can get. It appears the world’s most enthusiastic government for climate change is now embroiled in lies & cover-up.
I don’t understand this data adjustment stuff. If I get bad data, I throw it out and repeat the measurement.
The GISS climate mode is one of the worse models, according to the following paper.
http://www.agu.org/pubs/crossref/2012/2011JD017237.shtml
http://www.agu.org/cgi-bin/highlights/highlights.cgi?action=show&doi=10.1029/2011JD017237&jc=jd
Actually, the key point of the paper is not showing the climate models are improving, but how bad they performs, especially in simulating the clouds and water vapor in the upper troposphere