From the GCCI report on page 24:
Increased extremes of summer dryness and winter wetness are projected for much of the globe, meaning a generally greater risk of droughts and floods. This has already been observed, and is projected to continue. In a warmer world, precipitation tends to be concentrated into heavier events, with longer dry periods in between.
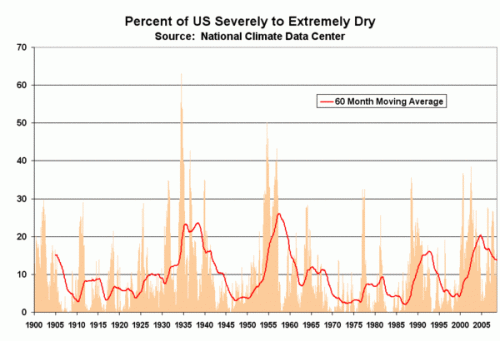
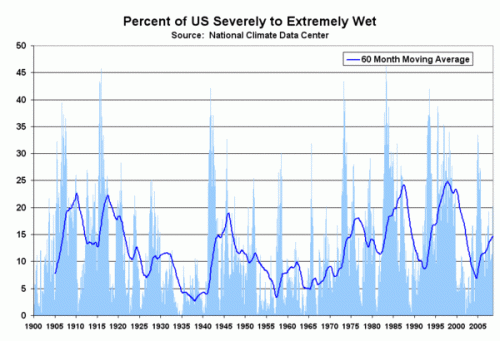
Later in the report they make the same claims for the US only. I can’t speak for the rest of the world, but I don’t know what data they are using. This is from the National Climate Data Center, run by the same folks who wrote this report:
Maybe my Mark I eyeball is off, but it sure doesn’t look like any trend here, or that there we are currently at any particularly unprecedented levels today. Of course, the main evidence they have of increasing extreme rainfall is in this chart — but of course this is “simulated” history, rather than actual, you know, observations.


Comparing the peaks and valleys of the two graphs… when it’s wet it’s not dry and when it’s dry it’s not wet. I do note that the 1945-1975 cool period tended to be drier.
However, the report’s claim is unsupported by the science which they didn’t include. Why would warmer weather tend to cause longer periods of drought, rather than causing more thunderstorms? They should explain why they make that claim.
In their defense, maybe dry places are getting drier and wet places wetter (only more so, because in toto, precipitation must increase if evaporation increases.). Maybe, but I see no evidence for that.
I see similar charts on the NCDC website, but your look nicer, did you create them from the raw data link or do have a link for yours. I didn’t read the Scare report, but your excerpt above discusses their prediction, not what it. According to the data, it looks like we have been having more drought than during the past 40 years, but it was much worse twice in the last century. This is like hurricanes same thing. 2005 was a bad hurricane year but there have been others just as bad.
http://nofreewind.com/atlantic_hurricanes.jpg
http://www.coaps.fsu.edu/~maue/tropical/global_running_ace.jpg
this is all based on predictions and LIES. Lot’s of deliberate distortion and “unscientific” thought and the inability to accept any data which contradicts their theory. It is group think based on a their new environmental religion.
Temperatures have not really gone up since 1997, the trend line is FLAT for 12.5 years. Their “models” are simply in the toilet!!! This it the satellite date.
http://www.woodfortrees.org/plot/rss/from:1997/plot/rss/from:1997/trend
AnonyMoose:s
Global Warming Pessimists have conjectured in various papers and sites that warmer air holds more moisture, and therefore the air will become more humid with less precipation happening. This conjecture starts off with a scientific principle, but Global Warming Pessimist often ignore more than one scientific principle are at work in climate issues. And it is poor science to emphasize one prinicple in a model without even studying whether it dominates over other principles. Simple cross sectional analysis provides little guidance since there are hot places that are dry and hot places that are wet. The analysis needs to be more sophisticated than that. Longitudinal studies provide conflicting conclusions. Although the Midwest became drier with the increasing temperatures of the thirties, the whole nation became wetter as we warmed up from the seventies to the early 2000s.
Warren,
Very interesting: Do you have a graph that displays the difference betweent the percent of Extreme Dry and Extreme Wet graphs that you have shown in this post?