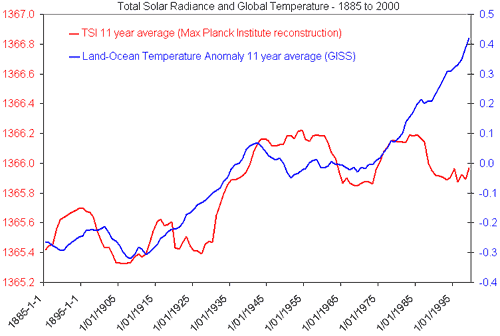
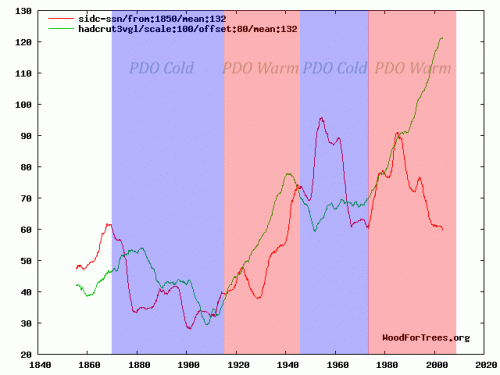
A reader wrote me a while back and asked if I could explain how I thought the sun could be a major driver of climate when temperature and solar metrics appear to have “diverged” as in the following two charts:


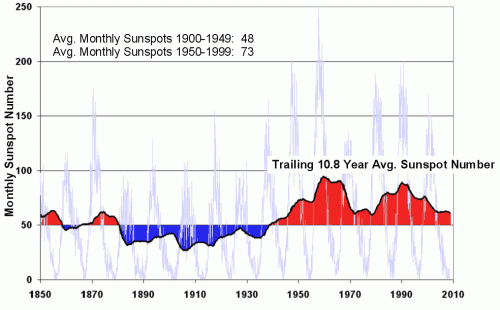
In both charts, red is the solar metric (TSI in the first chart, sunspot number in the second). The other line, either blue or green, is a global temperature metric. In both cases, we see a sort of step change in solar output, with the first half of the century at one plateau and the second half on a higher plateau. This chart of sunspot numbers may better illustrate this:

I had three answers for the reader:
- In any sufficiently chaotic and complicated system, no one variable is going to consistently regress perfectly with another variable. CO2 does not line up with temperature any better.
- There are non-solar factors at work. As I have said on any number of occasions, I agree that the greenhouse effect of CO2 exists and will add about 1C for each doubling of CO2. What I disagree with is the proposition that the Earth’s climate is dominated by positive feedback that multiplies this temperature increase 3-5 or more times. The PDO cycle is another example of a process that affects global temperatures.
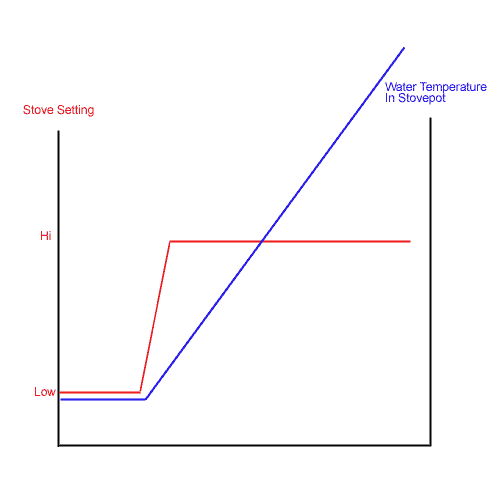
- One should not necessarily expect a linear temperature increase to be driven by a linear increase in the sun’s output. I will illustrate this with a simplistic example, and then invite further comment. I believe the following is a correct illustration of one heat source -> temperature phenomenon. If so, wouldn’t we expect something similar with step-change increases in the sun’s output, and doesn’t this chart look a lot like the charts with which I began the post?


Morganovich: the point is, when you put all the ‘MWP’ or LIA data sets together you don’t get a coherent and global cooling or warming. I know as I’ve tried. More importantly, Soon and balliunas tried hard to make a coherent global MWP and failed. There are warm periods at various times around MWP and cool periods at various times and places around LIA.
Re TSI etc. You would have to explain how you get a strong warming from a weak or non-existent TSI signal (high climate sensitivity if you manage it!!) as well as no warming from a huge increase in C02 emissions. I think that Occam’s Razor needs to be invoked here.
if your point is that creating data where there is unlikely to lead to good science, then i certainly agree. the recent ludicrous antarctic modeling campaign to attempt to demonstrate that the continent has been warming, not cooling, is an excellent example.
imputing global temperature from a small number of datapoints is difficult. the terrestrial temperature networks have this issue (as well as many others).
but if the widely geographically distributed samples taken register a MWP as warm or warmer than the current period by a ratio of easily 5:1 vs those that show it as cooler, we need to take that seriously. it is a fair bit of evidence that a MWP existed in many parts of the globe. obviously, there will be exceptions. areas of earth have cooled over the last 100 years in contradiction of the broader trend. this does not invalidate the trend. neither do a few “cool” records invalidate a MWP. while any reconstruction can be critiqued, the simple fact is that what data we have is very slanted toward a warmer MWP.
though i have not researched it thoroughly, a quick perusal of the info seems to show that most of the attacks on B+S come from mann and his teams. given that they have been utterly and totally discredited over and over by folks like mcintyre, i’d be careful in relying too much upon their conclusions. they have shown themselves to be highly dogmatic and very poor statisticians.
upon looking at it a bit more, it does seem like the B+S piece has some serious issues.
however, that does not make the fact that 4 out of 5 (to be generous) studies show a warmer MWP than present climate.
even mann’s data sets show it. only through statistical manipulation and heavy relaince on some questionable proxies could he make it disappear.
You’ve got some trolls here so I won’t stick around, but not everyone agrees that this “divergence” has actually occurred:
http://acrim.com/Reference%20Files/Secular%20total%20solar%20irradiance%20trend%20during%20solar%20cycles%2021%E2%80%9323_GRL_v30,%20(2003).pdf
The guys actually working with the satellites disagree with the solar theorists. These guys say solar irradiance rose since the seventies. Theorists, like Frolich and Lean, disagree. I side with the data guys over the theory guys, personally, but either way, flat or declining solar activity is not universally accepted. See also a recent publication:
Scafetta, N., and R. C. Willson (2009), ACRIM-gap and TSI trend issue resolved using a surface magnetic flux TSI proxy model, Geophys. Res. Lett., 36, L05701, doi:10.1029/2008GL036307
morganovich – do you think it’s not obvious that you don’t give a shit about science? Clearly you’ve got some personal reason to refuse to believe in climate science. What it is, I couldn’t say, but clearly your mind is closed.
Andrew – the difference between PMOD and ACRIM TSI reconstructions makes no difference at all to this debate. Use either and there is still no correlation between recent solar activity and global temperatures. Nor is it the case that one is from ‘guys working with satellites’ and the other is from ‘solar theorists’. Clearly you have no idea what you’re talking about, and again it seems you have some kind of ideological inability to actually understand some incredibly simple things.
Hunter, you are a joke. Go home.
Hunter-Richard Willson actually is on the TSI monitoring team for ACRIMSAT. AFAIK, Lean and Frolich are using proxy models to argue that corrections need to be made to the sattelite data, especially during the ACRIM gap. But since you seem to think that it “doesn’t matter”:
http://www.fel.duke.edu/~scafetta/pdf/2005GL023849.pdf
http://yosemite.epa.gov/ee/epa/wpi.nsf/09133da7fb9a95db85256698006641d1/7a5516152467a30b85257562006c89a6/$FILE/scafetta-epa-2009.pdf
Hunter-Richard Willson actually is on the TSI monitoring team for ACRIMSAT. AFAIK, Lean and Frolich are using proxy models to argue that corrections need to be made to the sattelite data, especially during the ACRIM gap. But since you seem to think that it “doesn’t matter”:
http://yosemite.epa.gov/ee/epa/wpi.nsf/09133da7fb9a95db85256698006641d1/7a5516152467a30b85257562006c89a6/$FILE/scafetta-epa-2009.pdf