
I am still reading the new Douglas and Christy paper, so I won’t comment on it yet, but you can see Anthony Watts thoughts here.
However, in reading Anthony’s site this morning, I was struck by a quote in another one of his posts. For a while, I have been telling folks that the main argument behind anthropogenic global warming is "we have looked at everything else, and we can’t think of what else it could be other than man." Lacking positive correlation between CO2 and major shifts in temperature (particularly when ice core evidence collapsed under the weight of the 800 year lag), scientists instead argue that they have gone through a long checklist (sun, clouds, volcanoes, etc) and have convinced themselves none of these others have caused late 20th century warming, so it must be man — that’s all that is left.
Here is an example, from Anthony’s site:
Bill Chameides, dean of Duke University’s Nicholas School of the Environment and Earth Sciences, said Spencer’s arguments are what magicians call “ignoratio elenchi” or logical fallacy.”We’ve looked at every possible form of heat, including clouds, and the only source of heat is greenhouse gases,” he said, adding it’s insulting that Spencer would suggest scientists are paid to come to this conclusion. “Scientists make their reputation on debunking theories.”
Well, a number of folks would beg to differ that scientists have truly eliminated every other possible cause, particularly Mr. Sun (more than really eliminating these effects, they seem to be seeking excuses to ignore them). In fact, climate models of late have admitted that they don’t even include the Pacific Decadal Osculation in their models, or didn’t until recently. So much for thinking of everything.
But if Mr. Chameides wants to talk in terms of logical fallacies, I will as well: Just because scientists cannot image another cause does not mean that another cause does not exist. Can you imagine the first astrophysicists to discover pulsars to say "well, we can’t think of anything else that would cause this phenomenon, so it must be space aliens." Well, come to think of it, some people did say that. But it turned out to be absurd, and after some decades of effort, we think we now understand pulsars. But it is a bizarre form of arrogance to assume that it is not possible in our current degree of climate knowledge that there is some factor we don’t even know about.
Long Postscript: I am working on a powerpoint presentation for next week on anthropogenic global warming, but here are two charts from that presentation that get at the "we can’t think of anything other than man that might be causing late 20th century warming." The first is the correlation between 20th century temperature and the PDO cycle (temperature numbers are Hadley CRUT3 and UAH combined as described here). By the way, there seems to be some argument over exactly where and how often to call the turns in the PDO early in the 20th century — I have used one frequent estimate but others exist.
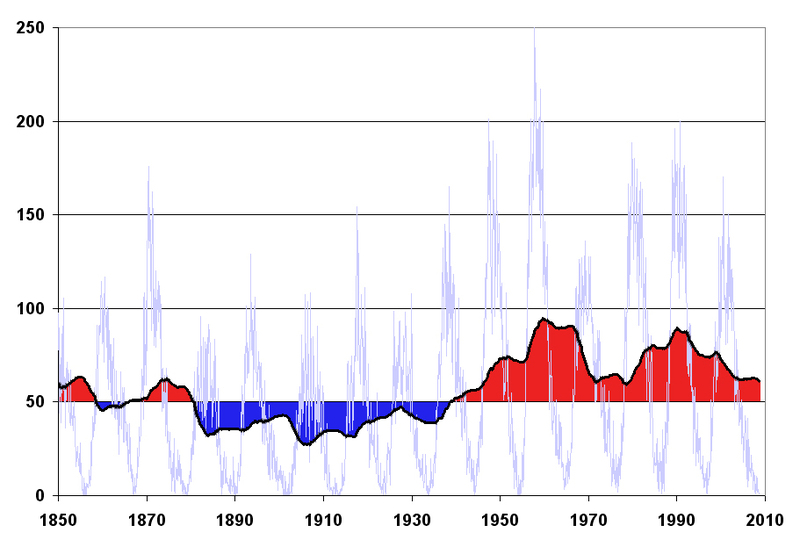
The second interesting analysis is a sunspot number chart. To highlight recent increases in activity, I have overlaid on the monthly International sunspot numbers (light blue) a 9.8 year moving average (in black) of sunspot numbers (9.8 selected as an average cycle length). In the chart below, selection of the 50 average sunspot number as a reference value is arbitrary, but serves to visually demonstrate the increase in solar activity over the last 50 years.

The average monthly sunspot number from 1900-1949 was 48. The average monthly number from 1950-1999 was 73.1, an increase of 52%.
Some of this increase is real, but some may be a measurement bias related to the ability to better detect smaller spots. Anyone have any sources on how large this latter effect might be? We are talking about an enormous percentage increase in the last half of the century, so my guess is that it is not all due to this bias.
If you want to ascribe the recent warming to something other than CO2, then you will also need to either explain how you increase the concentration of a strong infrared absorber by 40% without raising atmospheric temperatures, or invoke a third effect to offset the inevitable warming due to CO2. It’s pretty laughable to try and suggest some equivalence between attributing warming to increasing concentrations of a strong infrared absorber, and attributing pulsars to Little Green Men. And if you think that suggestion was ever serious, then your knowledge of the history of science is desperately deficient.
If you think that sunspot numbers are driving the warming, you ought to just look at the graph you’ve produced, and compare sunspot numbers in 1975 and now, and temperatures in 1975 and now. If you think that the Pacific Decadal Oscillation (note that spelling, by the way) is the sole driver of global temperatures, ask yourself how four roughly equal periods in each phase could raise temperatures by 0.8°C. It’s not rocket science, you know.
Many commentators are proclaiming, more in sorrow than in anger, that the melting of arctic pack-ice (which was high again this year) is a certain indicator of global warming. If this melting really was an indicator of Anthropogenic Global Warming, why was there no increased melting of the arctic ice in 1998, a year when atmospheric temperatures in the Northern hemisphere were indisputably higher than they were in either 2007 or 2008?
Furthermore, why is it necessary to be so coy in this matter and use the melting of arctic sea ice as an “indicator?”
If you visit your local doctor he will not say to you, unless he is stuck in the sixteenth century, “Hmnnn, red face eh; seems like you’ve got a high temperature.” He will stick a thermometer into your mouth and measure your temperature directly.
So why all this sage nodding of the head and intoning that the melting of arctic sea-ice “indicates” global warming? The arctic temperatures can be measured directly, so why not measure them and publish them, and then we can see reasonably easily whether these atmospheric temperatures at the North polar regions are higher than they were in 1998, for example, and whether they are high enough to bring about exceptional ice-melt.
If these directly measured temperatures are not high enough to bring about increased ice-melt then it is clear that some other factor is responsible, like warm water from either the Pacific or the Atlantic, or undersea volcanoes, or something else other than AGM.
They won’t measure Arctic temperatures for two reasons.
1. Its would be very problematic since there are no stationary places to put the instruments.
2. The don’t want to, it might show something they don’t want you to know.
Better to estimate the temperatures from stations 1000 miles away, that way you can just make it up as you go along.
“If this melting really was an indicator of Anthropogenic Global Warming, why was there no increased melting of the arctic ice in 1998, a year when atmospheric temperatures in the Northern hemisphere were indisputably higher than they were in either 2007 or 2008?”
Presumably because the climate system is profoundly complex with various feedbacks and time lags that come into play, and cannot be explained in term’s of someone’s simplistic expectations, I suppose.
It would probably enhance your graphs if you also plotted major volcanic eruptions such as Krackatoa which impart a varability to the longer term oscillations
What’s especially silly about the “we can’t think of anything else” argument is that the warmists can’t explain what (if anything) caused the Little Ice Age or the Medieval Warm Period. Their main response is to deny those phenomena by claiming that the Little Ice Age and Medieval Warm Period were coincidentally and conveniently limited to areas populated by people who kept decent records.
“increase the concentration of a strong infrared absorber by 40% without raising atmospheric temperatures”: the point is that it isn’t a strong absorber at the margin, because the effect is almost saturated. If you don’t know that, shame on you. If you do, you were being deceitful.
dearieme – you are incorrect. Increasing CO2 concentrations from 280 to >380ppm causes a significant increase in IR absorption. Absorption line centres may be saturated, but the wings are not. This leads to the well-known logarithmic relation between CO2 concentration and IR absorption.
Will Nitschke – “why was there no increased melting of the arctic ice in 1998” – remember that the elevated global average temperature in 1998 was due to El Niño. El Niño is a tropical phenomenon. There is no reason to think that polar ice melt magnitude would be strongly correlated with El Niño strength. Also, temperature is not the only factor affecting the magnitude of the ice loss. Last year’s unprecedented loss was assisted by strong winds pushing ice from the coast of Siberia into the open ocean.
Will,
Shame on you. Ice only melts due to conditions at the exact time it melts. Arguing complicated “time lags” is stupid. Ice melt is NOT effected by the conditions before or after the melting, only the conditions at the time the ice melts. Claiming a time lag influence from years past has nothing to do with the air temp, solar load, reflectance, etc that causes ice to melt.
“We cannot think of anything else” is also the argument used to explain the roughly 800 years gap between temperature changes and CO2 in the ice core records.
The true believer in AGW can look at the ice core record and see, for example: 800 years with temperatures rising while CO2 is low and falling; 4000 years with both CO2 and temperature rising; then 400 years with temperatures falling while CO2 is high and rising, and say that we do not know what caused the first and last of those periods, but over the majority of the period (4000 out of 5200 years) the two were in step. How else can you explain this 4000 years of correlation unless the CO2 causes the rise in temperature? They say that they have no other explanation for this long period of correlation, therefore the CO2 rise must be causing the temperature change.
To those of us who are sceptics the above argument seems simply perverse. However for anyone who is totally convinced that proven physical laws mean that higher CO2 must be causing higher temperatures, it is simply obvious.
When sceptics look at statistical data, whether it is recent ice melt, deep sea temperatures, current trend in global surface temperatures, troposphere temperatures, ice core records etc. they look at the data as it is without any pre-conceptions and describe what it says. When the AGW consensus looks at the same data they see it in the context of the “known science”. If they did not “know” that AGW was true they might be able to understand the points made by the sceptics. Without starting an off-topic diversion, it is rather like arguing with someone who believes in the literal truth of the Genesis creation story. They are always able to come up with an explanation for any scientific data pointing to the world existing for longer than 6000 years; and they will never be convinced by any evidence because they “know” that come what may the Bible is always true.
Relative to comments about CO2 being a “strong infrared absorber,” I believe that most skeptics — can I call them mainline skeptics? — accept that under laboratory conditions, a doubling of CO2 concentrations will result in increased temperatures. In fact, John Christy, a frequently quoted skeptic, has said that all scientists in his circle accept that the laboratory/theoretical implication of doubling CO2 is a one-degree increase in temperature. (I am not sure if he was referencing doubling from pre-industrial levels or doubling from current concentrations. That is not a moot issue given the logrthimic nature of CO2 effects.) The questions center on feedbacks and whether the CO2-induced increase is greater than the noise that we see in climate.
Quantifying climate as one statistic — global temperature anomaly — is a questionable practice both in theory and in application, but it is a commonly used statistic by both camps. My research of the GISS anomaly gives me no confidence in it for century-long run indications of global climate. HadCrut is more accepted, but it has received even less analysis. The two satellite temperature measurements are more appealing, but they have their issues also. At a rough level, all four have been moving in tandem for the last 29 years. Important point for me — where temperatures have gone in the last 29 years is not a concern to me. The movement in the last 29 years is more consistent with greater influence from PDO than CO2 increases. If we look at the temperatures for the last 100 years, then I get more concerned — if I believe GISS andn HadCrut. Do I believe GISS and HadCrut for the last 100 years because they have roughly tracked the satellite record for the last 29 years? I am inclined to say no. I look at the physical evidence of hot & dry weather in the 1930s. (For example, lakes disappeared in that decade but are back and vibrant today.) To be sure, I can offer only ancedotal evidence that the 30s were as hot as the 90s, but GISS is so full of questionable adjustments and illogical implications that I am more impressed with ancedotal evidence. What I really would like to see is a comprehensive record on the length of the growing season in rural areas. What is happening to the date of the first freeze? I had thought that such a record could confirm the HadCrut and GISS century-long records. However, when I googled growing season records, I found neither a comprehensive study nor the trends that I expected in individual sites.
Moreover, even if I am convinced that HadCrut and GISS have the century-record right, I would still not be overwhelmed with the influence of CO2 — the world was coming out of the LIA at that point in time.
As has been previously pointed out, global climate is incredibly complex with numerous influences that wax and wane and overlap. In the middle of all this noise, I do not see the overwhelming influence of CO2. I believe that I am open-minded to accept developling proof, but so far there has been no evidence to justify suggested forced governmental programs. For individuals to take actions based on their convictions, that is great; however, as we have seen, government programs tend to have unintended consequences and harm.
Why would it be easier as time progresses to see sunspots? The sun is not difficult to see (its huge), the spots are easily detectable visually. Any old set of optics will work, the real trick is in the filter – but I believe a pin-hole type approach works fine.
Is there any proof that our ability to detect sunspots has changed over the last 100 years?
My thoughts are that most recent advancements in solar observation are non-visual and are not asociated with detecting more spots. We have been counting spots for many years using similar procedures and devices (my contention).
Will Nitschke.
So you answer that “the climate system is profoundly complex with various feedbacks and time lags that come into play, and cannot be explained in term’s of someone’s simplistic expectations,” as an answer on the question why “this melting really was an indicator of Anthropogenic Global Warming”?
Is “complexity” an indicator which positively proves that less melting ice this year is caused by human global warming (btbw during a large temperature fall)?
You seem to assume that a proof for human global warming has occured, and don’t care about the (scientific) proof for that. You just avoid the question by “talking”? No one denies that (all!) phenomenon on earth are complex. This phenomenon, changes in the Arctic ice, is not one we have lots of knowledeg about, but ocean current seem to play a more important roll than we previously thought. Also there is a Scandinavian reserarch team on the Arctic who are testing the hypothesis that growing ice is caused by an increased amount of low level clouds, which they think is a egative feedback when the sea ice melting.
You gave us the impression that you answered a person which obviously tries to put doubt in the statement that humans has caused the Arctic ice to melt, but your answer, “complex”, didn’t had any rational content or answered anything. Ar you afraid of those who put doubt about a non-proved and, according to all data we have, non-likely hypothesis about CO2 as a primarily driver of the earth’s climate?
I’m afraid of the scientifically competely rubbish and politically dangerous — societally damaging — thought that CO2 emisisons are dangerous for the earth and nature and has to be removed.
I can think of a very strong possibility to explain the current situation.
Measurement error/poor measurement coverage…
Hey cfdman,
you hit the nail on the head with your observation that the melting of sea ice can only be caused by the immediate circumstances; that complex and delayed actions have no bearing.
Now, can you or anyone else post the actual arctic atmospheric temperatures that prevailed during the summer just past, last years summer and the summer of 1998?
Can you post the temperatures that prevailed, in the arctic, over the last ten years, so we can have some comparison?
My question still stands: why was there a large arctic sea ice melt in 2008 and 2009 and not in 1998, given that 1998, for whatever reason, was a year of high summer temperatures in the Northern Hemisphere?
Ah yes, Mr Sceptic, time to learn. The idea that they have looked at everything is just the sort of magician trick that you discussed. There was this little study by Kevin Trenberth that concluded that the Pacific Climate Shift must have been a result of GHG’s. It’s their dirty little secret as to how they can show how observed and predicted late 20th century temperatures differ. You see, they know about ocean circulation and it’s effect on climate, they just consider those changes to be anthropogenic because Kevin said so.
The comment was:
“If this melting really was an indicator of Anthropogenic Global Warming, why was there no increased melting of the arctic ice in 1998, a year when atmospheric temperatures in the Northern hemisphere were indisputably higher than they were in either 2007 or 2008?”
To this I objected as an absurd simplification of a complex climate system. A response was:
“Shame on you. Ice only melts due to conditions at the exact time it melts.”
Right. Conditions in the polar regions where ice is melting or forming, is important. Not global average temperature. Hence you criticize my objection by contradicting yourself.
This is why many Deniers are viewed by rational people as “crackpots”: because they can’t form or maintain rational arguments. Something that Alarmists take full advantage of.
I wonder why Douglas and Christy published their paper in Energy and Environment? After all, their results (if confirmed) would be truly startling and would represent a major addition to the science. Such major papers would normally be published in the mainstream literature (JGR, GRL, one of the Physica journals etc). Could it be that they know the science is flawed….and the only place to get it published is in a silly, sceptic journal like E&E?
It reminds of the time that Christopher Monckton published his attack on IPCC climate sensitivity in the Sunday Telegraph (a right-wing British newspaper). I said to him at the time that if he was so sure of his results, he should submit them to peer-review. Needless to say, this didn’t happen. As so often with the sceptic arguments, they fail because there is little hard science behind them.
In reply to “An Inquirer”:
(I am not sure if he was referencing doubling from pre-industrial levels or doubling from current concentrations. That is not a moot issue given the logrthimic nature of CO2 effects.)
I think you misworded this- it should have been “That is a moot issue”
Regarding the squabble regarding ice melt in 1998 versus 2007 and 2008:
Water conducts about 24 times better than air, which is why those “Titanic” passengers froze to death in a few minutes in 32 degree water while nobody freezes to death in a few minutes in 32 degree air.
Obviously the air temperature difference between warmer in 1998 vs cooler in 2007 and 2008 was a much smaller factor that the cooler water in 1998 vs warmer water in 2007 and 2008.
http://www.nasa.gov/vision/earth/lookingatearth/quikscat-20071001.html
“Nghiem said the rapid decline in winter perennial ice the past two years was caused by unusual winds. “Unusual atmospheric conditions set up wind patterns that compressed the sea ice, loaded it into the Transpolar Drift Stream and then sped its flow out of the Arctic,” he said. When that sea ice reached lower latitudes, it rapidly melted in the warmer waters.
“The winds causing this trend in ice reduction were set up by an unusual pattern of atmospheric pressure that began at the beginning of this century,” Nghiem said. “
Is that 9.8 years or 10.8 years – graph and text mismatch.
san quintin,
Why should it matter where a study is published? Its merit rests on its substance and robustness when tested by other scientists.
If there is “little hard science behind” skeptical arguements, there is arguably no “hard science” behind claims from the AGW crowd. There is no “hard science” in climate science, the discipline is far too young to be that definite. All we have is competing theories, not proofs. Since you can not prove a theory, only disprove it, by definition a single disproof of a theory must invalidate it. This is how science is done.
You believe what you believe, based on whatever study you have done on the topic at hand. Others believe differently. What you accept as hard science, others reject as unproven theories.
To Alan D McIntire,
Thanks for your reply; I looked up the website given and, along with your remarks about the superior conductivity of water, it provides a very satisfactory explanation for the recent sea-ice melt. And it casts into strong relief the bad faith of the alarmists who claim that this melting is a certain “indicator” of AGW.
Cheers,
Warwick
While I am not a scientist, it baffles me as to why anyone would correlate cloud cover with warming. In my 65+ years, I can assure you that cloud cover indeed does just the opposite. In fact, if AGW creates more clouds, then this can only indicate that it is self healing. Clouds are a necessary precursor to storms. Storms are cooling. Therefore, more clouds, more cooling. In Arizona, when clouds appear, it doesn’t take a sampling of the entire earths temperature to judge whether the temperature on the surface of the earth goes up or goes down… ask anyone.
That this logic is ignored by the AGW crowd, makes their other arguments very suspect.
In reply to rightwing: You’re right that more daytime clouds lead to cooling. NIGHTTIME clouds tend to trap heat and lead to less cooling at night- so sunny days and cloudy nights would lead to warming-
I’m with righwing and find it hard to believe that a major greenhouse gas like water vapor is at the mercy of a minor greenhouse gas like CO2 it is much more likely that what ever warming we maybe see from CO2 gets offset by water vapor.
In the last billions of years there is no indication of a runaway climate due too CO2 why would there be one now.
“In the last billions of years there is no indication of a runaway climate due too CO2 why would there be one now.” – have you never heard of the Paleocene-Eocene thermal maximum?
jnicklin – of course it matters which journal you publish your work in. If you publish it in a joke journal, no-one will read it. If you think you’ve done quality science, why wouldn’t you publish in a quality journal? Why wouldn’t you seek the biggest impact possible? The obvious supposition is because your work wouldn’t stand up to the scrutiny a decent journal would give it.
“scientist” aka mckitrick aka god knows what else, i could at least respect your standing up for your beliefs regardless of my disagreement with them. your constant adoption of new names is not fooling those of us who know you. if you think your ideas have merit, why do you hide them behind false names and a deliberate attempt to make readers think they are conversing with someone other than you?
morganovich – I have not the slightest clue what you are talking about. The expression ‘play the ball, not the man’ comes to mind though.
Well from what I can gather the cause of the Paleocene thermal maximum is unclear some speculate it was CO2 other like to link it to a release of large amount of methane.
It isn’t really clear what happened first did it get warm and than the gasses got released or did the gasses cause the warming.
Interesting is that in the graph on Wiki it’s called a Eocene Optimum wile others call it thermal maximum giving it a more negative condemnation.
Todays pet hypothesis is GW caused by greenhouse gasses I’m wondering what scientist would have found 40 years ago at the hight of the global cooling hypothesis linking both cooling events perhaps due too a large aerosol release.
“of course it matters which journal you publish your work in.”
Logical fallacy, argument from authority…
Not a good tactic on a sceptical website, where the majority of readers tend to be independent thinkers. You could add “Must be true because this is what the IPCC told us”, which is another expression of the same idea.
Argument from authority is a good rule of thumb principle for a mature scientific research field with solid empirical backing and testable and verified hypothesis. It’s of less help as a rule of thumb guide in a relatively immature research field. If you can demonstrate that the AGW theory has solid empirical backing and has made accurate predictions on future climate events, then I will agree with your assessment. Conviction doesn’t make up for rational argumentation, whether you are an Alarmist or a Denier.
McKitrick wrote: > (note that spelling, by the way)
Noted. Note also the pilpulistic precedent you’ve just set.
McKitrick wrote: > Last year’s unprecedented loss
Unprecedented? Quoting the grammarian Patricia T. O’Conner: “Don’t use unprecedented to mean unusual, uncommon, odd, unexpected, rare, exceptional, curious, irregular, offbeat, or surprising. No matter how extraordinary something sounds to you, there’s probably a precedent for it” (Patricia T. O’Conner, Woe Is I). Mr McKitrick, have you never heard of the Paleocene-Eocene Thermal Maximum (note the capitals, by the way)?
McKitrick wrote: > have you never heard of the Paleocene-Eocene thermal maximum?
Indeed. Candidly, it sometimes seems as if every time I turn around, you’re trotting her out. (See, for example, your comment here on March 28, 2008, at precisely 2:29 PM.)
McKitrick wrote: > no-one will read it.
Hyphenating no one these days, are we, Mr. McKitrick? Webster and Chicago certainly prefer that we do not. I think you must be going very deep inside Oxford — and when I say that, I hope you don’t get the wrong impression: I am not referring to your honeymoon.
McKitrick wrote: > The obvious supposition is because [sic] your work wouldn’t stand up to the scrutiny a decent journal would give it.
Obvious, perhaps, but sloppy nevertheless — at least, insofar as it assumes that “decent” journals invariably provide high-powered “scrutiny,” which in any case they do not necessarily.
McKitrick wrote: > The expression ‘play the ball, not the man’ comes to mind though.
My dear fellow! When though is used as an adverb, it must be offset with a comma. I’m afraid I’m inflexible on that. It matters not how many men you play — or, for that matter, how many balls — the rule is straightforward: insert the comma. The expression “Don’t hate the player; hate the game” comes to mind.
Syllogistically, as I’ve said before, the entire anthropocentric global warming position can be recapitulated thus:
Global warming is man-made. Man is
http://www.the-thinking-man.com/origins-of-government.html” rel=”nofollow”>ruled by governments. Therefore, government bureaus, centralized planning committees, and more laws are the only solution.
But this is hardly follows. Quoting Dr. George Reisman:
The environmentalist solution to global warming is the diametric opposite of economic freedom and the pursuit of material self-interest that it allows and the economic success that that pursuit brings. The environmentalist solution is the massive violation of economic freedom and the imposition of massive economic sacrifice, in the insane belief that the way to cope with the destructive forces of nature is to deprive man of his means of coping with them, as though he, and not nature, were the cause of those destructive forces, as though nature, left to itself, were benign.
Our good host is correct to shift the focus of this wildly arousing AGW debate to its epistemological underpinnings; that is the locus of the AGW error.
Will Nitschke – I think you misunderstand. There is no argument from authority in saying that if you publish your work in a joke journal, no-one will read it.
Thin king man – that’s a whole lot of yapping with no scientific content whatsoever.
To declare a particular scientific journal a “joke” (in your unsupported opinion) is in fact an ad hominem. So now you’ve defended an argument from authority fallacy, with another logical fallacy.
If you want to express an opinion that would not immediately be viewed by everybody reading it as completely worthless, you could try to defend your position by providing links to credible sources that support the argument that the scientific journal you disparage is in fact a “joke”, by providing lines of evidence for your assertion.
Your PDO Warm and Cool graph is a good description of the temperatures. What it shows is that the earth warms quickly when a Warm phase is in operation, but cools very little when a Cool phase is operating.
It would be reasonable for a Global Warming supporter to say that this shows a general (probably CO2-driven) warming trend. Emphasised by the Warm period, counteracted by the Cool period, but the average is still upwards.
How would you answer that?
Dodgy Geezer,
Way to stay on track. The main issue related to the temp graph is that most of the period warming depicted on the plot came in the first warming section before the intermediate cooling. But during this first warming section, industrialization that contributes most of man’s CO2 output was emergent (or non-existent#.
So, if the temp goes up a great deal due to man’s CO2 during a period when man contributed little CO2 – and up much less when man was generating butt-loads of CO2…..PUNCH LINE: the warming is not directly caused by the CO2, or even positively correlated #and probably not related at all).
My thesis: CAGW is caused by Bats, because I thought it was caused by CO2 and now thats disproven – leaving only Bats. I heard it was vampire bats at that.
Dodgy Geezer: “What it shows is that the earth warms quickly when a Warm phase is in operation, but cools very little when a Cool phase is operating. It would be reasonable for a Global Warming supporter to say that this shows a general (probably CO2-driven) warming trend. Emphasised by the Warm period, counteracted by the Cool period, but the average is still upwards. How would you answer that?”
cfdman: “The main issue related to the temp graph is that most of the period warming depicted on the plot came in the first warming section before the intermediate cooling”
The problem with the question and the answer is that the time span is very short and many other factors may be coming into play that are not well understood. To answer this question properly it would be necessary to view climate cycles over hundreds of thousands of years. If the slower cooling phase is still evident (as there is more CO2 in the atmosphere during the peak of the warm cycle which should keep temperatures warmer for longer) then this should constitute empirical evidence for CO2’s effects on the climate. If cooling is, on average, as rapid as the heating, then this should constitute empirical evidence against AGW.
Warren,
Is this the presentation that you are going to give at the RCRC Annual Meeting in South Lake Tahoe? I am planing on attending just to hear your presentation and see the reaction of he County Supervisors to Joe Nation’s and your presentation. Our local BOS is growing concerned over the implementation of AB-32. See you in Tahoe.
Russ
Will Nitschke – please explain, with reference to some dictionary definitions, how describing a journal as a joke is ‘ad hominem’. Then, please try and find ‘Energy and Environment’ in the ISI list of journals, in Journal Citation Reports, or in any other objective measure of journal quality. Tell us what you find.
cfdman: if the temp goes up a great deal due to man’s CO2 during a period when man contributed little CO2 – and up much less when man was generating butt-loads of CO2 – please tell us four pieces of data, to back up this claim. 1. the temperature change in the first period you are referring to. 2. the temperature change in the second period you are referring to. 3. the radiative forcing due to CO2 in the first period. 4. the forcing due to CO2 in the second period.
McKitrick: You’re making the assertion, so it’s your duty to defend it if you can. It’s not my job or anyone elses to do your research for you. If you’re too lazy to back-up your opinions with facts, please be slightly more lazy and not post worthless comments at all.
ad hominem argument (argument against the person)
The informal fallacy of supposing that a proposition should be denied because of some disqualifying feature of the person who affirms it. This fallacy is the mirror image of the appeal to authority. In its abusive form, ad hominem is a direct (and often inflammatory) attack on the appearance, character, or personality of the individual.
http://www.philosophypages.com/dy/a.htm
Or in other words, attacking the journal, not the merits of the technical arguments contained within the paper itself.
I have to say, calling an organisation, entity or individual a “joke” and then claiming it’s not a ‘personal attack’ is remarkably dopey.
Roy W. Spencer is a well known AGW ‘Denier’ a PHD, U.S., Science Team Leader for the Advanced Microwave Scanning Radiometer (AMSR-E) on NASA’s Aqua satellite, holder of the NASA Exceptional Scientific Achievement Medal, published in Nature (one of the most prestigious science journals in the world), yet some of his most basic scientific ideas are clearly ridiculous. That’s the problem with the standard AGW Alarmist argument that ‘prestige’ = ‘truth’ in science.
To McKitrick:
“the temperature change in the first period you are referring to”, look at the plot above. Silly objection.
“the temperature change in the second period you are referring to”, again look at the plot above. Rediculous
“the radiative forcing due to CO2 in the first period. 4. the forcing due to CO2 in the second period”, WTF? Are you daft man? Do you even know what these terms mean?
You must be referring to the emittence of CO2, and referring to it as radiative forcing. This is not a term found in thermodynamics, so I am not sure what exactly it means. When referring to a gas, I would expect words like: emittence, absorbtion, albedo, reflectance, capacitance, you get the idea. What is radiative forcing due to CO2?
PS: Numbering stuff does not make your arguments look better posed or your words look more sophisticated.
Oh dear, Will Nitschke, it takes a special kind of stupidity to confuse ‘journal’ with ‘person’. It also takes a bit of an idiot to miss the point of what I was saying. I did not even comment on the quality of the science. I asked why they would choose to publish it in a joke journal, if they were sure it was good science? And rest assured, Energy and Environment is indeed a joke journal. If you’re too thick to understand the facts I gave you showing that this is so, that is your problem.
cfdman. Indulge us and tell us the first two numbers I asked for, would you? Remember that you described the first as ‘a great deal’, and the second as ‘much less’. We can all look at the graphs, but it appears that only you can find such a large difference between the two. So, explain how you did that, won’t you?
what is radiative forcing, you ask. Well, it’s a rather basic term in climate science, that anyone who doesn’t wish to look profoundly stupid would do well to know before forming an opinion on climate science issues. The radiative forcing due to a change in concentration of CO2 is the change in balance between incoming and outgoing radiation caused by the change in CO2 concentration. It’s pretty staggering that you obviously had no idea about this very basic concept.
McKitrick: “Oh dear, Will Nitschke, it takes a special kind of stupidity to confuse ‘journal’ with ‘person'”
Right, journals aren’t written ‘by people’ you imply. If you disparage a journal, a blog, a product, a committee, you are not of course insulting the ‘person’ or ‘persons’ involved… of course not.
Nonetheless, word games don’t disguise lack of logical reasoning.
McKitrick,
Excellent, you completely mis-read my point and spouted crap that was irrelevant. And your a pompous ass, but back to the point.
What does the absorbtivity and emmisivity of CO2 have to do with the fact that CO2 concentrations have nothing to do with warming, and are not even positively correlated with warming? Try to answer the question this time around, if you can. The radiative forcing garbage is just a distraction you are using to confuse.
Will Nitschke – you may notice that generally in life many things come in a wide range of qualities. Some things are very very good, and others are very very bad. If you consider that describing something as belonging in the bad category is insulting and offensive to everyone involved with it, no matter what it is, then you must be a very sensitive person. Just as scientology is a joke “religion”, the United Kingdom Independence Party is a joke political party, and the Daily Sport is a joke newspaper, Energy and Environment is a joke journal. You may console its proprietors, editors, publishers and contributing authors if you wish; it won’t change the fact that research published there has zero scientific impact.
cfdman – The radiative forcing garbage is just a distraction you are using to confuse is truly one of the funniest things I’ve seen in any climate-related forum. Now, what do you make of this graph?
Odd isn’t it? Here are two scientists who think they have found a major flaw in AGW and instead of publishing in JGR, GRL, Physica A or D etc etc decide to publish it in Sonia’s loony sceptic journal. I wonder why that is? Sounds like they didn’t think they would get it into a journal with referees who understood the science.
Sorry to hear that AGW offends your political and ideological views. Doesn’t mean it’s not happening.
BOW DOWN BEFORE US, THE GLOBAL WARMING GODS. THE ONLY RELIGIOUS DOCTRINE THAT SHOULD BE FOLLOWED ARE THE PUBLICATIONS THAT ARE REVEIWED AND PUBLISHED BY US GODS. ALL OTHERS, NO MATTER HOW SOUND THE SCIENCE, ARE JUST JOKES.
quintin Aren’t the papers you mention are more political paper then scientific papers as they are only willing to publish papers that fall in line with what the IPCC stands on the matter is.
Richard S. Lindzen just published a paper called Climate Science: Is it currently designed to answer questions?
http://arxiv.org/abs/0809.3762
The Old Farmer’s Almanac has more credibility as they have the guts to publish a critical view on AGW.
McKitrick,
Good graph, lets discuss in more detail. The period that I believe most illustrates my point is the time frame between 1940 and roughly 1980. During this period the CO2 concentration was presumed to have smoothly continued to grow, but temps dropped considerably. This is not a small amount of time that could be easily ignored as scatter, variation, complicated lag, or whatever the latest excuse.
The obvious conclusion is that temps (even if we agree they are as plotted), do not correlate well with CO2 concentration.
As a side point, I beleive the data behind this plot does not back out the popular “heat island” effect of the temp stations in the US being heated by civilization. If this is backed out, I have seen the argument that the cooling period that starts at 1940 essentially extends to the present. As virtually all graphs showing heating rely to some degree on these temp guages (because they are numerous and relatively well maintained and stable), and most alarmists do not properly correct for it (by weighting the undisturbed stations more heavily, or eliminating the corrupted ones), I do not think much of these graphs or this argument.
But I stand: CO2 is not positively correlated (much less well correlated) with CO2 concentrations. Your graphs helps my point (although not as much as it would if it actually showed global temps properly).
PS: I do appreciate the good arguments instead of insults, I’ll refrain as well.