The table of contents for the rest of this paper, A Layman’s Guide to Anthropogenic Global Warming (AGW) is here. Free pdf of this Climate Skepticism paper is here and print version is sold at cost here.
As stated in the introduction, the purpose of this paper has not been to provide a balanced portrayal of Anthropogenic Global Warming (AGW) theory; its purpose instead is to provide a comprehensive overview of skeptic’s concerns with AGW theory. However, the issues raised here are not necessarily new, and AGW supporters have attempted to address many of them.
The New Scientist, a fairly strong and reliable voice for advocacy of anthropogenic global warming theory, recently published its response to what it calls 26 myths about global warming, many of these “myths” being correlated loosely with skeptics concerns about AGW theory as outlined in this paper. Walking through their points seems a reasonable way to entertain a rebuttal to the skeptic’s position. Each of these has a link to the New Scientist article in question. I have tried to summarize the position with a quote, shown in italics. My response to each then follows.
Before I get into these 20 myths, note that many of the key skeptic’s questions are neatly avoided. While the magazine gives itself certain softball questions, it does not attempt to take on skeptics questions such as:
- Isn’t warming from CO2 a diminishing return, such that each 10ppm of CO2 has less warming effect than the last 10 ppm?
- Isn’t warming from CO2 asymptotic, such that total warming from CO2 is capped?
- Isn’t 2/3 or more of the future warming in IPCC forecasts due to positive feedback effects that tend to be rare in stable systems and that even the IPCC admits are poorly understood?
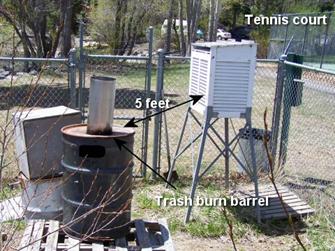
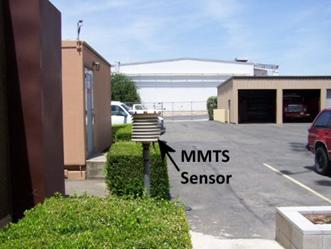
- Aren’t there a lot of problems with ground-based temperature measurements?
- Aren’t the historical proxies for temperature diverging from measurements, such that the IPCC actually dropped many of the recent proxy measurements to hide this result?
There are many others, but we can get at them tangentially through dealing with the 20 “myths” below
• Human CO2 emissions are too tiny to matter
So what’s going on? It is true that human emissions of CO2 are small compared with natural sources. But the fact that CO2 levels have remained steady until very recently shows that natural emissions are usually balanced by natural absorptions. Now slightly more CO2 must be entering the atmosphere than is being soaked up by carbon "sinks".
Though I do know that some skeptics will claim that man can’t be changing world CO2 levels, I don’t believe I even tried to make that claim in this paper.
The more salient point in asking whether human CO2 emissions are too tiny to matter is to ask whether the change in composition of the atmosphere of 0.009% by human activities is substantial enough to affect world climate in any important way, particularly when the portion being increased, CO2, is a relatively weak greenhouse gas vs. other portions.
• We can’t do anything about climate change
It is true that the action taken so far, such as the Kyoto Protocol, will only have a marginal effect. The protocol’s authors have always described it as a first step. But even before it came into effect in 2005, the protocol has triggered some profound thinking among governments, corporations and citizens about their carbon footprint and how to reduce it. Industrialized countries such as the UK are planning for emissions reductions of 60% or more by mid-century.
This is a bit of a straw man. Certainly to the extent that man is causing climate change, men with enough will can do something about it. The question is whether the costs justify the avoided change – this is a question that I have addressed sufficiently and won’t revisit here. However, I would like to comment on this:
We may find that once the process has begun, the world loses its addiction to carbon fuels surprisingly quickly. Natural scientists fear “tipping points” in the climate system. But there are also tipping points in social, economic and political systems. Once under way, things can happen fast…
This is a statement to which I both agree and disagree. I am a technological optimist, and so generally accept that world-changing technologies will continue to spring from man’s mind, and that the introduction of these changes can be fast and their impact dramatic. The only reason that I am a tad skeptical about this statement is that the vast majority of strong AGW adherents are technology pessimists, so it would be uncharacteristic for them to take such a position. Absent unimagined new technologies, change of the type AGW supporters are hoping for is actually not a positive feedback process as implied in this statement. Why is it that climate scientists see so many positive feedback processes, when these are actually so rare? In fact, most investment decisions, for example investments to reduce CO2 emissions, follow a diminishing return relationship. Early investors capture the low-hanging fruit, while each successive wave of investment offers a lower return (here, in CO2 reduction) for each incremental dollar invested.
• The ‘hockey stick’ graph has been proven wrong
Most researchers would agree that while the original hockey stick can – and has – been improved in a number of ways, it was not far off the mark. Most later temperature reconstructions fall within the error bars of the original hockey stick. Some show far more variability leading up to the 20th century than the hockey stick, but none suggest that it has been warmer at any time in the past 1000 years than in the last part of the 20th century.
No one statement by AGW supporters would do more to build my confidence in their findings than to actually have someone say “the Mann hockey stick was a deeply flawed analysis, and we have taken great pains to make sure the flaws identified in Mann are not present in other historical reconstructions.” However, when I see the statement above, I am left to wonder if any of the flaws in Mann have actually been corrected in other works, or if systematic errors still exist. Since AGW supporters refuse to acknowledge flaws in Mann, it is almost certain that these flaws still exist in the other analyses (therefore making it unsurprising that new analyses show roughly the same results). Remember that Mann was replaced by Biffra as lead author of this section of the Fourth IPCC report, and it was Biffra who dropped 20-30 years of recent data from his historical reconstruction when it did not show the result that he wanted it to.
• Chaotic systems are not predictable
Getting reasonably accurate predictions is a matter of choosing the right timescale: days in the case of weather, decades in the case of climate.
Climate scientists sometimes refer to the effects of chaos as intrinsic or unforced variability: the unpredictable changes that arise from the dynamic interactions between the oceans and atmosphere rather than being a result of "forcings" such as changes in solar irradiance or greenhouse gases.
The crucial point is that unforced variability occurs within a relatively narrow range. It is constrained by the major factors influencing climate: it might make some winters bit a warmer, for instance, but it cannot make winters warmer than summers
There are systems people who would both agree and disagree with this statement. The real study of chaotic systems is barely older than the study of global warming, and most mathematicians would say that the issue of long-term predictability of macro trends in chaotic systems is not settled science.
However, one issue the statement overlooks is that even if chaotic systems have some long-term order, at least when “viewed from a distance,” this does not mean that the drivers of those long-term trends can be discerned by those of us standing in the chaos. So while it may be theoretically possible to predict long-scale climate changes, it may still be impossible to discern the true drivers of these climate systems amidst the chaos, making the long-term prediction problem moot.
Remember, no one has a thermometer that provides two readings – temperature due to “natural” causes and temperature due to man-made forcings. The only argument one can make outside of a laboratory is to try to correlate temperature changes to certain other variables, like CO2 level. But in a chaotic system, when thousands of variables may matter, and there are all kinds of cross-dependencies between variables, definitively showing direct correlation, much less causation, is very hard, possibly impossible. Remember, outside lab experiments, climate scientists main argument that CO2 is causing current warming is “We have checked everything else it possibly could be, and it wasn’t those things, so it must be CO2.” In a chaotic system, such a statement borders on hubris.
• We can’t trust computer models of climate
Climate is average weather, and it can vary unpredictably only within the limits set by major influences like the Sun and levels of greenhouse gases in the atmosphere. We might not be able to say whether it will rain at noon in a week’s time, but we can be confident that the summers will be hotter than winters for as long as the Earth’s axis remains tilted.
The validity of models can be tested against climate history. If they can predict the past (which the best models are pretty good at) they are probably on the right track for predicting the future – and indeed have successfully done so.
I hope that if you have learned anything from this paper, you already know how to refute the statement above. Climate models match history because they have been tuned and tweaked and overridden to do so. The fact that they then can reproduce history is meaningless. Even more, you should run away quickly from anyone who makes this statement, because they are either ignorant of what they are talking about or they are trying to sell you the Brooklyn Bridge.
Finally, the claim is sometimes made that if computer models were any good, people would be using them to predict the stock market. Well, they are!
A lot of trading in the financial markets is already carried out by computers. Many base their decisions on fairly simple algorithms designed to exploit tiny profit margins, but others rely on more sophisticated long-term models.
Sorry, but this is a facile and ignorant mis-interpretation of what financial models are doing. Yes, people are running long-term financial models as part of a trading strategy, but these models feed into very short-term trading decisions. If you looked at the output from these long-term models, you would see that they are changing constantly as new data flows in. There is an old joke about two campers who see a bear growling at them. One of them starts putting his tennis shoes on. The other one says to him “Why are you putting your shoes on? You can’t outrun that bear.” His friend replied “I don’t have to outrun the bear. I just have to outrun you.” Traders’ long-term models work the same. They don’t actually expect them to be right, they just want them to be better, based on current conditions, than other traders’ models, then they can make money.
• They predicted global cooling in the 1970s
Indeed they did…. However, Schneider soon realised he had overestimated the cooling effect of aerosol pollution and underestimated the effect of CO2, meaning warming was more likely than cooling in the long run….
The calls for action to prevent further human-induced global warming, by contrast, are based on an enormous body of research by thousands of scientists over more than a century that has been subjected to intense – and sometimes ferocious – scrutiny. According to the latest IPCC report, it is more than 90% certain that the world is already warming as a result of human activity
We have already dealt with aerosols, and unlike many skeptics I have not really held the 1970’s global cooling panic against the climate community. The last paragraph is just circular. Saying the IPCC is 90% sure does not answer the arguments about what skeptics feel the IPCC is ignoring.
• It’s been far warmer in the past, what’s the big deal?
First of all, it is worth bearing in mind that any data on global temperatures before about 150 years ago is an estimate, a reconstruction based on second-hand evidence such as ice cores and isotopic ratios. The evidence becomes sparser the further back we look, and its interpretation often involves a set of assumptions. In other words, a fair amount of guesswork.
This is hilarious. What happened to their confidence in Mann and 1000-year temperature reconstructions just a few myths back? But to continue, the answer is basically yes, but:
The important question is what is causing the current, rapid warming? We cannot dismiss it as natural variation just because the planet has been warmer at various times in the past. Many studies suggest it can only be explained by taking into account human activity.
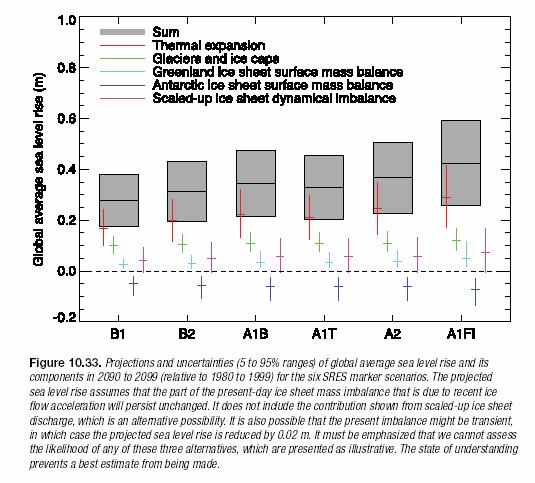
Nor does the fact that it has been warmer in the past mean that future warming is nothing to worry about. The sea level has been tens of metres higher during past warm periods, enough to submerge most major cities around the world.
Here is why it matters – beyond the laboratory evidence of the greenhouse effect, which tells us merely that there is an affect and not how strong it is, the main evidence cited by AGW supporters for current warming being man-made is to try to show that current warming is somehow unprecedented, and therefore unlikely to be natural. So it is odd here that AGW supporters simply shrug their shoulders here and say that it is not important that current warming be unprecedented.
• It’s too cold where I live – warming will be great
This does not sound too bad, and for many people it won’t be. Wealthy individuals and countries will be able to adapt to most short-term changes, whether it means buying an air conditioner or switching to crops better suited to the changing climate. Rainfall will fall in mid-latitudes but rise in high latitudes, and initially agricultural yields will probably. Some regions will suffer, though. Africa could be hardest hit, with yields predicted to halve in some countries as early as 2020.
As global temperature climbs to 3°C above present levels – which is likely to happen before the end of this century if greenhouse emissions continue unabated – the consequences will become increasingly severe. More than a third of species face extinction. Agricultural yields will start to fall in many parts of the world. Millions of people will be at risk from coastal flooding. Heatwaves, droughts, floods and wildfires will take an ever greater toll.
I hope readers will accept that I am not exaggerating or constructing straw men when I talk about the dire predictions by AGW supporters. There is nothing here that we have not dealt with earlier, except perhaps the rainfall. Of late, AGW supporters seem to have shifted to rainfall (rather than sea level rise) as their lead scary topic. Note, however, that even the IPCC admits that it and all of its modelers really do not understand (even a little bit) the effect of global warming on rainfall and drought. Logic says that with more water evaporated, while global warming may cause now local draughts, overall rainfall should increase. I would bet any amount of money that lower economic growth due to aggressive CO2 abatement will have a far more deleterious effect on worldwide agricultural yields than global warming.
• Global warming is down to the Sun, not humans
So what role, if any, have solar fluctuations had in recent temperature changes? While we can work out how Earth’s orbit has changed going back many millions of years, we have no first-hand record of the changes in solar output associated with sunspots before the 20th century.
It is true that sunspot records go back to the 17th century, but sunspots actually block the Sun’s radiation. It is the smaller bright spots (faculae) that increase the Sun’s output and these were not recorded until more recently. The correlation between sunspots and bright faculae is not perfect, so estimates of solar activity based on sunspot records may be out by as much as 30%.
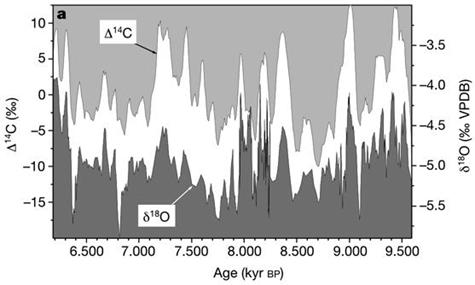
The other method of working out past solar activity is to measure levels of carbon-14 and beryllium-10 in tree rings and ice cores. These isotopes are formed when cosmic rays hit the atmosphere, and higher sunspot activity is associated with increases in the solar wind that deflect more galactic cosmic rays away from Earth. Yet again, though, the correlation is not perfect. What is more, recent evidence suggests that the deposition of beryllium-10 can be affected by climate changes, making it even less reliable as a measure of past solar activity.
This is again a pretty hilarious statement. One could easily argue that temperature and CO2 proxies have at least as much uncertainty. One wonders why AGW advocates do not seem as concerned about the errors in the proxies they hold dear. But anyway, to continue:
But even if solar forcing in the past was more important than this estimate suggests, as some scientists think, there is no correlation between solar activity and the strong warming during the past 40 years. Claims that this is the case have not stood up to scrutiny (pdf document).
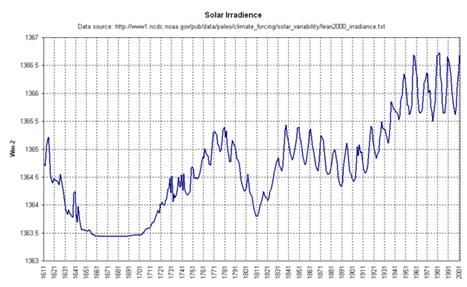
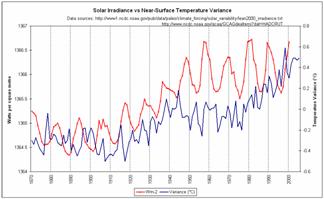
Direct measurements of solar output since 1978 show a steady rise and fall over the 11-year sunspot cycle, but no upwards or downward trend .
Similarly, there is no trend in direct measurements of the Sun’s ultraviolet output and in cosmic rays. So for the period for which we have direct, reliable records, the Earth has warmed dramatically even though there has been no corresponding rise in any kind of solar activity.
This is another you-study-my-study pissing match. I am happy to admit that our knowledge of the sun’s changing impact on climate is poor, and that it is hard to separate out this one effect in a chaotic system. I refuse to fall into the same scientific hubris as AGW supporters. However, those who think the sun has some contribution to warming are buttressed by the knowledge that they are working with the main driver of climate, rather than a secondary variable.
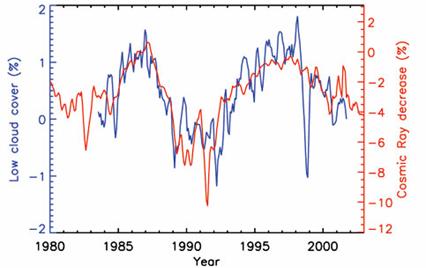
• It’s all down to cosmic rays
There is no convincing evidence that cosmic rays are a major factor determining cloud cover. The ionising of air by cosmic rays will impart an electric charge to aerosols, which in theory could encourage them to clump together to form particles large enough for cloud droplets to form around, called "cloud condensation nuclei".
But cloud physicists say it has yet to be shown that such clumping occurs. And even if it does, it seems far-fetched to expect any great effect on the amount of clouds in the atmosphere. Most of the atmosphere, even relatively clean marine air, has plenty of cloud condensation nuclei already.
A series of attempts by Svensmark to show an effect have come unstuck. Initially, Svensmark claimed there was a correlation between cosmic ray intensity and satellite measurements of total cloud cover since the 1980s – yet a correlation does not prove cause and effect. It could equally well reflect changes in solar irradiance, which inversely correlate with cosmic ray intensity.
I am starting to notice a trend here of making statements about competing that could be applied equally well to AGW theory. And what about all those points they made above, reminding us over and over that CO2 greenhouse theory works in the lab. Now the lab is not good enough?
However, I would accept that the cosmic ray theory is pretty undeveloped and not acceptably proven. It has had a number of fits and starts. Just like CO2 greenhouse theory, the cosmic ray effect on climate can be reproduced in the lab, but it is really hard to parse out its effects in the chaotic climate.
• CO2 isn’t the most important greenhouse gas
At some of these overlaps, the atmosphere already absorbs 100% of radiation, meaning that adding more greenhouse gases cannot increase absorption at these specific frequencies. For other frequencies, only a small proportion is currently absorbed, so higher levels of greenhouse gases do make a difference.
This means that when it comes to the greenhouse effect, two plus two does not equal four.
Wow! An AGW supporter actually said this in public. This is to our point that there is a diminishing return from incremental CO2 in the atmosphere. Of course, they say this in the context of trying to show why water isn’t as important as it might seem, but still, it’s there
But the overall quantities of these other gases are tiny. Even allowing for the relative strength of the effects, CO2 is still responsible for two-thirds of the additional warming caused by all the greenhouse gases emitted as a result of human activity.
Water vapour will play a huge role in the centuries to come, though. Climate models, backed by satellite measurements, suggest that the amount of water vapour in the upper troposphere (about 5 to 10 kilometres up) will double by the end of this century as temperatures rise.
This will result in roughly twice as much warming than if water vapour remained constant. Changes in clouds could lead to even greater amplification of the warming or reduce it – there is great uncertainty about this. What is certain is that, in the jargon of climate science, water vapour is a feedback, but not a forcing.
Again, I am not getting into this, we covered it plenty in the paper. When they say “CO2 is still responsible for two-thirds of the additional warming” (and remember this is an output of their models, not any other analysis) what they really mean is that “our models that were programmed to have CO2 drive the climate show that CO2 drives the climate.” Note that in a three paragraph answer about the effect of water vapor as a climate feedback, only three words – “or reduce it” – acknowledge that it might actually have a negative feedback effect, despite the fact that even the IPCC includes cloud cover as a negative feedback. They just don’t want to admit a negative feedback might even exist.
• The lower atmosphere is cooling, not warming
One study in Science revealed errors in the way satellite data had been collected and interpreted. For instance, the orbit of satellites gradually slows, which has to be taken into account because it affects the time of day at which temperature recording are taken. This problem was always recognised, but the corrections were given the wrong sign (negative instead positive and vice versa).
A second study, also in Science, looked at the weather balloon data. Measurements of the air temperature during the day can be skewed if the instruments are heated by sunlight. Over the years the makers of weather balloons had come up with better methods of preventing or correcting for this effect, but because no one had taken these improvements into account, the more accurate measurements appeared to show daytime temperatures getting cooler.
The corrected temperature records show that tropospheric temperatures are indeed rising at roughly the same rate as surface temperatures. Or, as a 2006 report by the US Climate Change Science Program (pdf) puts it: "For recent decades, all current atmospheric data sets now show global-average warming that is similar to the surface warming." This one appears settled.
There is still some ambiguity in the tropics, where most measurements show the surface warming faster than the upper troposphere, whereas the models predict faster warming of the atmosphere. However, this is a minor discrepancy compared with cooling of the entire troposphere and could just be due to the errors of margin inherent in both the observations and the models.
First, observe absolutely ruthless efforts to apply corrections and adjustments to any measurement that does not fit their theory, while blithely accepting the surface temperature measurements that we showed can be really unreliable. Given the choice of focusing on managing satellite temperatures up or surface temperature down, you can see which they chose. Second, note that this is another narrow one study conclusion. AGW supporters frequently cite single studies (conducted by AGW supporters) that overturn skeptics arguments as having “settled” the issue. There are still many reasons to think that troposphere temperature increases are less than surface increases. Finally, even temperature increases that were the same between the surface and the troposphere would be a real problem for AGW theory. The authors here act like this surface-troposphere issue is a minor deal, but in fact if AGW theory is right, the troposphere has to warm more, because that is where the extra heat is being absorbed. This is not at all settled.
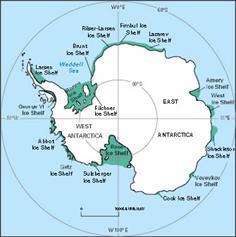
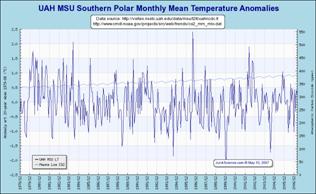
• Antarctica is getting cooler, not warmer, disproving global warming
It is clear that the Antarctic Peninsula, which juts out from the mainland of Antarctica towards South America, has warmed significantly. The continent’s interior was thought to have warmed too, but in 2002 a new analysis of records from 1966 to 2000 concluded that it has cooled overall….
Climate models do not predict an evenly spread warming of the whole planet: changes in wind patterns and ocean currents can change the distribution of heat, leading to some parts warming much faster than average, while others cool at first.
Agreed
• The oceans are cooling
Now the authors of the 2006 study have submitted a correction (pdf format). It turns out that a fault in the software on some of the floats led to some temperature measurements being associated with the wrong depth.
Meanwhile, work by other teams suggests that the past warmth of the oceans has been overestimated. The problem was due to expendable sensors that are thrown overboard and take measurements as they sink.
I never had heard the claim that the oceans were cooling, so it does not surprise me that they are not. However, it is again interesting the amount of due diligence that AGW supporter put in to the correction of any temperature measurement the might refute global warming, while blithely accepting the atrocious condition and biases in ground-based temperature measurement because, well, because these instruments are telling the story they want to hear.
• The cooling after 1940 shows CO2 does not cause warming
The mid-century cooling appears to have been largely due to a high concentration of sulphate aerosols in the atmosphere, emitted by industrial activities and volcanic eruptions. Sulphate aerosols have a cooling effect on the climate because they scatter light from the Sun, reflecting its energy back out into space.
The rise in sulphate aerosols was largely due to the increase in industrial activities at the end of the second world war. In addition, the large eruption of Mount Agung in 1963 produced aerosols which cooled the lower atmosphere by about 0.5°C, while solar activity levelled off after increasing at the beginning of the century
I think I was pretty fair in discussing the aerosol cooling hypothesis in this paper, though many would disagree with the above statement’s certainty.
Climate models that take into account only natural factors, such as solar activity and volcanic eruptions, do not reproduce 20th century temperatures very well. If, however, the models include human emissions, including greenhouse gases and aerosols, they accurately reproduce the 1940 to 1970 dip in temperatures.
I hope readers who have made it this far can supply the refutation of this point: Wrong, wrong, wrong. Climate models initially matched history poorly. Today they match well because they have been tweaked and adjusted and forced to match. They match because they are programmed to match. And, as we discussed, they match only because they make ridiculously low assumptions for natural forcings, and assume all natural forcings causing temperatures to rise in the first half of the century magically reversed in 1950, though there is no good evidence for it.
• It was warmer during the Medieval period, with vineyards in England
In the southern hemisphere, the picture is even more mixed, with evidence of both warm and cool periods around this time. The Medieval Warm Period may have been partly a regional phenomenon, with the extremes reflecting a redistribution of heat around the planet rather than a big overall rise in the average global temperature.
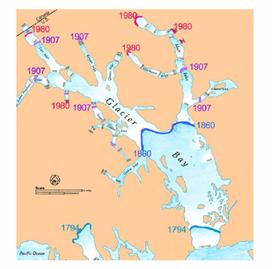
What is clear, both from the temperature reconstructions and from independent evidence – such as the extent of the recent melting of mountain glaciers – is that the planet has been warmer in the past few decades than at any time during the medieval period. In fact, the world may not have been so warm for 6000 or even 125,000 years (see Climate myths: It has been warmer in the past, what’s the big deal?).
What really matters, though, is not how warm it is now, but how warm it is going to get in the future. Even the temperature reconstructions that show the greatest variations in the past 1000 years suggest up until the 1980s, average temperature changes remained within a narrow band spanning 1ºC at most. Now we are climbing out of that band, and the latest IPCC report (pdf format) predicts a further rise of 0.5ºC by 2030 and a whopping 6.4ºC by 2100 in the worst case scenario.
We have covered this pretty well in this paper, so again I won’t go back into it, except to highlight a couple of things we can learn from this statement. First, note the hubris again – it is warmer today than in the last 125,000 years. I sure wish there was a way to bet on this – I would have only a one in 125,000 chance of being wrong in betting against this statement. Second, note the use of the worst case scenarios. For 2100, we don’t get the best case or even the average case, we get the worst case. Can you name another branch of science where people do this? Can you imagine, say, a group out to measure the speed of light. They are going to get some middle figure with an error band of some range. Wouldn’t you expect them to day that they found the speed of light to be so-and-so, plus or minus an error of such-and-such size? If they were climate scientists, they would instead announce that they have found the speed of light could be as large as Z, that being the highest possible figure in their error band.
• We are simply recovering from the Little Ice Age
Yet while there is some evidence of cold intervals in parts of the southern hemisphere during this time, they do not appear to coincide with those in the northern hemisphere. Such findings suggest the Little Ice Age may have been more of a regional phenomenon than a global one.
Solar radiation was probably lower at times during this period, especially during a dip in solar activity called the Maunder minimum around 1700, but models and temperature reconstructions suggest this would have reduced average global temperatures by 0.4ºC at most.
The larger falls in temperature in Europe and North American may have been due to changes in atmospheric circulation over the North Atlantic, or in the Gulf Stream, or both, reducing heat transport from the tropics (see Climate change sceptics lose vital argument).
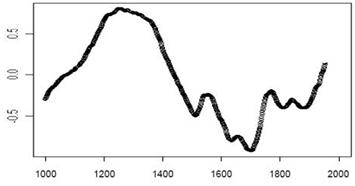
The warming after the so-called Little Ice Age may reflect both an increase in solar activity and a redistribution of heat around the planet. In particular, the increase in global temperature in the first half of the 20th century may have been largely due to an increase in solar activity. The continued warming in recent decades, however, cannot be explained by increases in solar radiation alone
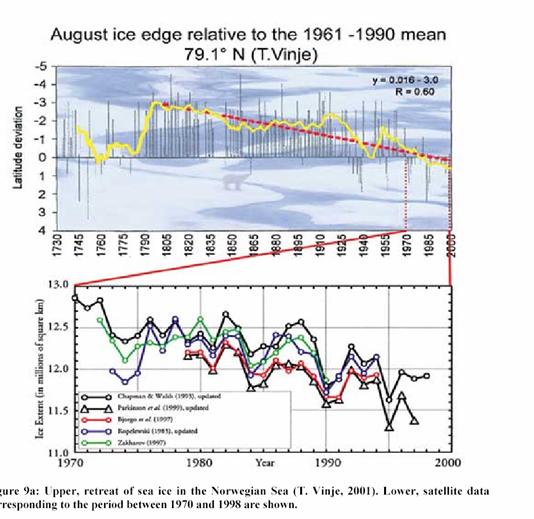
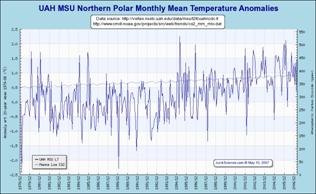
Remember the graphs we showed earlier – the arctic proxies look like the current warming is a straight linear increase from the 1700s to today. In fact, in the IPCC spaghetti graph showing all those historic reconstructions, they all show a natural warming from the 18th and 19th century through the 20th. Again, AGW supporters really need to explain why they are so confident that this natural warming trend stopped in 1945 or so, exactly and coincidently at the exact same moment that man-made forcings caused the world to continue to warm, coincidently at about the same rate it was warming naturally earlier in the century.
• Warming will cause an ice age in Europe
Few scientists think there will be a rapid shutdown of circulation. Most ocean models predict no more than a slowdown, probably towards the end of the century. This could slow or even reverse some of the warming due to human emissions of greenhouse gases, which might even be welcome in an overheated Europe, but the continent is not likely to get colder than it is at present.
A slowdown in circulation would affect many parts of the world by disrupting global rainfall patterns. But these effects will be insignificant compared with the much greater changes global warming will cause
I already mentioned that this had been refuted pretty well
• Ice cores show CO2 increases lag behind temperature rises, disproving the link to global warming
It takes about 5000 years for an ice age to end and, after the initial 800 year lag, temperature and CO2 concentrations in the atmosphere rise together for a further 4200 years.
What seems to have happened at the end of the recent ice ages is that some factor – most probably orbital changes – caused a rise in temperature. This led to an increase in CO2, resulting in further warming that caused more CO2 to be released and so on: a positive feedback that amplified a small change in temperature. At some point, the shrinking of the ice sheets further amplified the warming.
Models suggest that rising greenhouse gases, including CO2, explains about 40% of the warming as the ice ages ended. The figure is uncertain because it depends on how the extent of ice coverage changed over time, and there is no way to pin this down precisely.
I was extremely happy to see that they at least tried to address the issue I raised, ie is it really realistic to have a process dominated by positive feedback, and if so, why doesn’t it run away. Their answer:
Finally, if higher temperatures lead to more CO2 and more CO2 leads to higher temperatures, why doesn’t this positive feedback lead to a runaway greenhouse effect? There are various limiting factors that kick in, the most important being that infrared radiation emitted by Earth increases exponentially with temperature, so as long as some infrared can escape from the atmosphere, at some point heat loss catches up with heat retention.
Which might make sense EXCEPT that they are claiming that today’s temperature and level of CO2 are higher than these historical levels, so we are already higher than the level where they claim “heat loss catches up with heat retention.” So either their answer is right, and there is a strong compensating process which is not built into their models, or they are wrong and they still need to explain what keeps a positive feedback dominated process from running away.
• Ice cores show CO2 rising as temperatures fell
There are some mismatches though. Besides lags at the end of ice ages, cores taken from the ice overlying the famous lake below Vostok in Antarctica seemed to show that about 120,000 years ago, the temperature plummeted sharply while CO2 levels remained high for many thousands of years.
The question is whether this is real or just a reflection of the problems with working out the age of the trapped air and with deuterium as a temperature indicator. Many researchers are working on ways to independently date the air and the ice, and to improve temperature reconstructions based on relative deuterium content. One involves working out what is called the deuterium excess by comparing the relative amounts of deuterium and oxygen-18 in the ice.
The deuterium excess reflects the temperature at the sea surface where the water that later fell as snow evaporated, rather than the surface temperature where the snow fell. It helps to reveal whether variations in the relative deuterium content of the ice are a result of water coming from a different source region rather than changes in local temperature.
In 2001, researchers used the deuterium excess to correct for some of the problems with the temperature record of the Vostok ice core. Their results produce a much closer fit between temperature and CO2 levels and reduces the mismatch around 120,000 years ago to a few thousand years.
I did not really raise this issue, as even the most enthusiastic AGW supporter does not tend to claim that CO2 drives all historic temperature changes. However, again, note the pattern – any historic data that does not fit with AGW data typically is scrutinized and “corrected.” Articles discussing flaws in methodology in gathering such data are quickly published. Contrast this with the difficulty scientists have in questioning any data that supports AGW theory. As we saw earlier, the New Scientist still can’t bring itself to utter the words “the Mann hockey stick was flawed.” Neither could the IPCC, they just sort of dropped it, or buried it in the midst of 12 others, without even saying why the analysis that was the centerpiece of their last report was strangely missing.
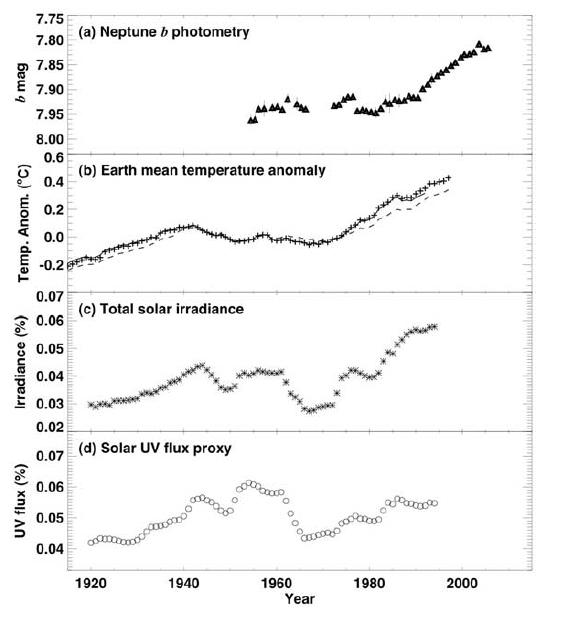
• Mars and Pluto are warming too
The Sun’s energy output has not increased since direct measurements began in 1978. If increased solar output really was responsible, we should be seeing warming on all the planets and their moons, not just Mars and Pluto.
Our solar system has eight planets, three dwarf planets and quite a few moons with at least a rudimentary atmosphere, and thus a climate of sorts. Their climates will be affected by local factors such as orbital variations, changes in reflectance (albedo) and even volcanic eruptions, so it would not be surprising if several planets and moons turn out to be warming at any one time.
I agree we have a lot to learn about this, and nothing at all is settled. However, we now have evidence from at least 5 other terrestrial bodies that are warming at the same time the Earth is warming. Why do AGW supporters resist at least investigating further?
• Many leading scientists question climate change
Climate change sceptics sometimes claim that many leading scientists question climate change. Well, it all depends on what you mean by "many" and "leading". For instance, in April 2006, 60 "leading scientists" signed a letter urging Canada’s new prime minister to review his country’s commitment to the Kyoto protocol.
This appears to be the biggest recent list of sceptics. Yet many, if not most, of the 60 signatories are not actively engaged in studying climate change: some are not scientists at all and at least 15 are retired.
Compare that with the dozens of statements on climate change from various scientific organisations around the world representing tens of thousands of scientists, the consensus position represented by the IPCC reports and the 11,000 signatories to a petition condemning the Bush administration’s stance on climate science.
I have carefully avoided the game of dueling scientific numbers. As to the claim that the skeptic list “are not actively engaged in studying climate change: some are not scientists at all and at least 15 are retired” I would be thrilled if AGW supporters held to this standard in making their own numbers. But, they manage to abandon this standard by the next paragraph, when they claim the pro-AGW numbers, like the 11,000, are open to the same criticism (since there are only 500-600 true climate scientists in the world, vs. physicist, meteorologists, etc).
• It’s all a conspiracy
Now that there is a consensus, those whose findings challenge the orthodoxy are always going have a tougher time convincing their peers, as in any field of science. For this reason, there will inevitably be pressure on scientists who challenge the consensus. But findings or ideas that clash with the idea of human-induced global warming have not been suppressed or ignored – far from it.
Journalists do have an interest in promoting themselves (and their books), while their employers want to boost their audience and sell advertising. Publicity helps with all these aims, but you get far more publicity by challenging the mainstream view than by promoting it. Which helps explain why so many sections of the media continue to publish or broadcast the claims of deniers, regardless of their merit.
The notion of a “conspiracy” of course, is a useful straw man, implying devious villains in the SPECTRE conference room planning the overthrow of the world. I won’t argue the point again, except to encourage you to watch the news with a critical eye, and decide for yourself. However, just to get you started, ask yourself if these events are signs of healthy, unbiased science:
· A group of AGW supporters are trying to get the British government to use force to block the publication of a skeptical movie (the Global Warming Swindle)
· AGW supporters in California have included skeptical scientists such as MIT’s Dr. Richard Lindzen as defendants in a law suit, asking that damages be paid by people and companies whose public speech doesn’t conform to AGW theory
· Many AGW skeptics have been unable to get scientists who have published publicly funded research to reveal their data and methodology for critique. Freedom of Information Act (FOIA) requests have become a necessary tool of climate skeptics.
· When a group began photographing temperature measurement points to document the shortcomings in historical surface temperature measurements, the NOAA pulled the locations of its measurement stations off the Internet so that these US citizens could no longer take pictures of and critique US government installations.
· Scientists who question AGW theory are equated by AGW supporters with Holocaust deniers.
• Hurricane Katrina was caused by global warming
More data is needed settle the issue. Some are looking to natural records of past hurricane activity in stalagmites, lake deposits and coral rubble. Others are re-analysing existing databases. In February 2007, one such re-analysis concluded that over the past two decades, hurricane intensity has increased in the Atlantic but not in other parts of the world (pdf format).
Yet another complicating factor is that changes in climate can also change the paths that tropical cyclones tend to take, determining whether they remain over oceans or strike land.
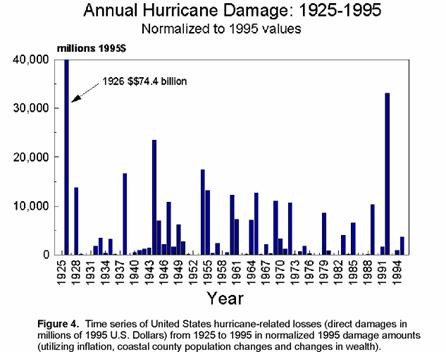
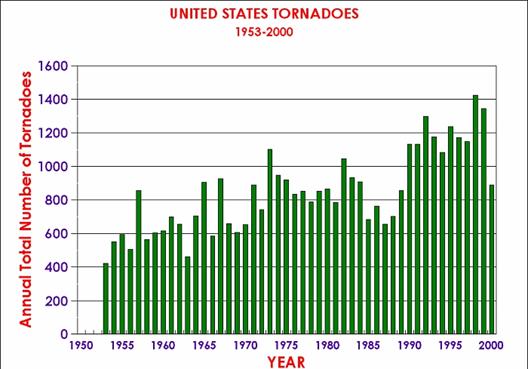
What every one agrees on is that over the past few decades there has been a huge rise in the number of people being killed or injured by hurricanes, and in damage to infrastructure, and this trend looks set to continue. The main reason for this, however, is that more and more people are living and building in hurricane zones.
Most of these three paragraphs is entirely correct – there is no evidence that hurricane numbers or intensity are effected by global warming, and if they are, whether they are increased or decreased. However, Hurricane Katrina was most certainly NOT caused by global warming. Why can’t they just say that? It may have been made stronger or weaker. Its course may have been altered. But it was not created by warming. By the way, the year after Katrina saw a much smaller than average Atlantic hurricane season.
• Higher CO2 levels will boost plant growth and food production
But it is extremely difficult to generalise about the overall impact on plant growth. Numerous groups around the world have been conducting experiments in which plots of land are supplied with enhanced CO2, while comparable nearby plots remain at normal levels.
While these experiments typically have found initial elevations in the rate of plant growth, these have tended to level off within a few years. In most cases this has been found to be the result of some other limiting factor, such as the availability of nitrogen or water.
So the answer is yes, but there is a diminishing return at some point. Isn’t that the same as can be said for the CO2 greenhouse effect?
Predicting the world’s overall changes in food production in response to elevated CO2 is virtually impossible. Global production is expected to rise until the increase in local average temperatures exceeds 3°C, but then start to fall. In tropical and dry regions increases of just 1 to 2°C are expected to lead to falls in production. In marginal lands where water is the greatest constraint, which includes much of the developing world but also regions such as the western US, the losses may greatly exceed the gains.
Have you noticed yet that things that might hurt the AGW-interventionist’s case always seem “impossible to predict” while the climate is well within our prediction capabilities?
As for food crops, the factors are more complex. The crops most widely used in the world for food in many cases depend on particular combinations of soil type, climate, moisture, weather patterns and the infrastructure of equipment, experience and distribution systems. If the climate warms so much that crops no longer thrive in their traditional settings, farming of some crops may be able to shift to adjacent areas, but others may not. Rich farmers and countries will be able to adapt more easily than poorer ones.
I love the rich-poor language. The leftish New Scientist simply can’t help itself. But I will accept this statement, and go further: This is the reason that aggressive actions to reduce CO2 that reduce economic growth, particularly in the developing world, may not make sense. To the extent that some climate change will occur no matter what, or is already programmed by our past actions, then a richer world can deal with it better than a poorer one.
• Polar bear numbers are increasing
Yet recently there have been claims that polar bear populations are increasing. So what’s going on? There are thought to be between 20,000 and 25,000 polar bears in 19 population groups around the Arctic. While polar bear numbers are increasing in two of these populations, two others are definitely in decline. We don’t really know how the rest of the populations are faring, so the truth is that no one can say for sure how overall numbers are changing.
Again, I love this. We can know the global temperature increase over a century to a tenth of a degree but it is impossible to count polar bears.
A comprehensive review (pdf) by the US Fish and Wildlife Service concluded that shrinking sea ice is the primary cause for the decline seen in these populations, and it recently proposed listing polar bears as threatened (pdf) under the Endangered Species Act. The International Conservation Union projects the bears’ numbers will drop by 30% by 2050 (pdf) due to continued loss of Arctic sea ice.
Note that down 30% (which coming from an environmental advocacy ground has got to be considered the most extreme possible estimate) is not “extinct.” The article fails to address at all the issue that polar bears have survived through eras when Arctic sea ice melted completely in the summers. And there are many reasons for threats to polar bear numbers – most experts would say that hunting and threats to habitat are much more important factors than global temperatures.
The table of contents for the rest of this paper, A Layman’s Guide to Anthropogenic Global Warming (AGW) is here. Free pdf of this Climate Skepticism paper is here and print version is sold at cost here.
The open comment thread for this paper can be found here.


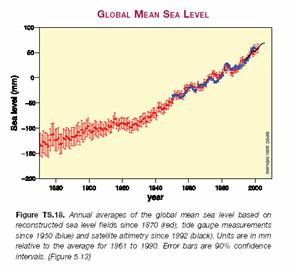
 By no means does this variation disprove a causal relation between CO2 concentrations and global temperature. However, it also can be said that this chart is by no means a slam dunk testament to such a relationship. Here is how strong AGW supporters explain this data: Strong AGW supporters will assign most, but not all, of the temperature increase before 1950 to “natural” or non-anthropogenic causes. The current IPCC report in turn assigns a high probability that much or all of the warming after 1950 is due to anthropogenic sources, i.e. man-made CO2. Which still leaves the cooling between 1940 and 1979 to explain, which we will cover shortly.
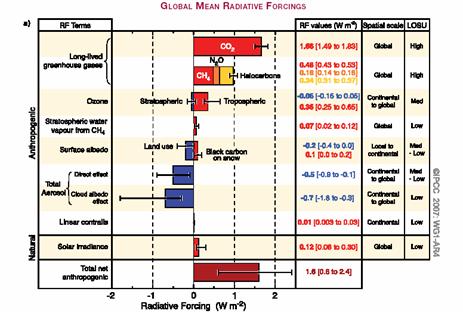
 The aerosol hypothesis is that sulfate aerosols and black carbon are the main cause of global dimming, as they tend to act to cool the Earth by reflecting and scattering sunlight before it reaches the ground. In addition, it is hypothesized that these aerosols as well as particulates from combustion may act to seed cloud formation in a way that makes clouds more reflective. The nations of the world are taking on sulfate and particulate production, and will likely substantially reduce this production long before CO2 production is reduced (mainly because it is possible with current technology to burn fossil fuels with greatly reduced sulfate output, but it is not possible to burn fossil fuels with greatly reduced CO2 output). If so, we might actually see an upward acceleration in temperatures if aerosols are really the cause of dimming, since their removal would allow a sort-of warming catch-up.


 So, is it reasonable to assume these feedback loops? First, none have really been proven empirically, which does not of course necessarily make them wrong. . In our daily lives, we generally deal with negative feedback: inertia, wind resistance, friction are all negative feedback processes. If one knew nothing else, and had to guess if a natural process was governed by negative or positive feedback, Occam’s razor would say bet on negative. Also, we will observe in the next section that when the models with these feedbacks were first run against history, they produced far more warming than we have actually seen (remember the analysis we started this section with – post-industrial warming implies 1-1.5 degrees sensitivity, not four).
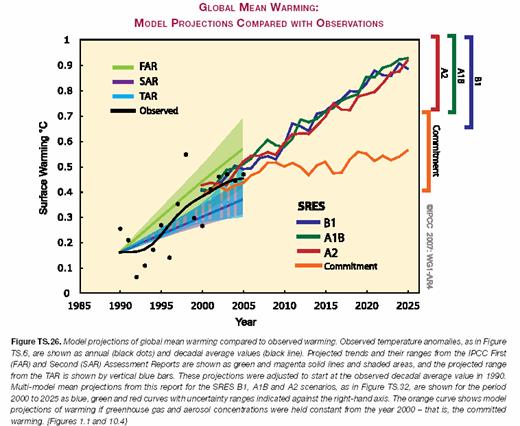
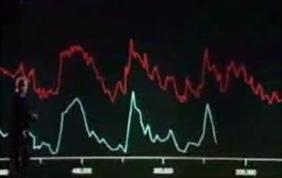
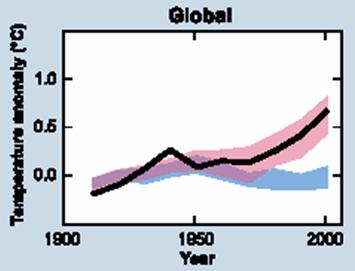 The blue band is without anthropogenic effects. The pink band is with anthropogenic effects, including warming CO2 and cooling aerosols. The black line is measured temperatures (smoothed out of course).
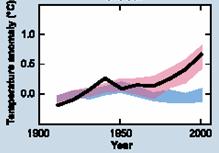

