
The table of contents for the rest of this paper, A Layman’s Guide to Anthropogenic Global Warming (AGW) is here. Free pdf of this Climate Skepticism paper is here and print version is sold at cost here.
Solar Irradiance
If you walked into a room and found that it was too hot, would you, as a first step:
- Measure the air to find anomalies in the mix of gasses
- Count the number of people in the room, to assess the effect of body heat on the room’s temperature
- Check the thermostat on the furnace
If you answered #3, sorry, but you can’t join the IPCC. If you really want to irritate an AGW supporter, ask about the sun. To AGW supporters, only a Luddite would check the sun’s output when they could instead be obsessing over the increase in CO2 by 0.009% of the atmosphere.
When they looked at the problem, the IPCC decided that over the last 50 years, the sun has been irrelevant to warming. Note that the blue band in this chart (described in more detail in the last section), the IPCC thinks that without man, the world would have cooled over the last 50 years:
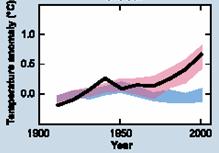
Further, when they detailed different climate forcings, the forcing from changing solar irradiance was a trivial rounding error (though they had the good grace to mark their understanding of this as “low”) meaning the sun has very little effect vs. what the sun had in 1850 (in the Little Ice Age!)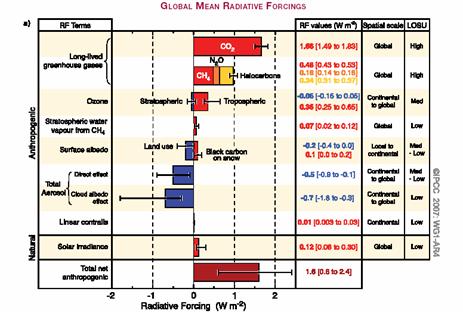
But it turns out, interestingly, that solar irradiance may be close to its highest point in centuries. Al Gore says that current global temperatures are the highest they have been in 1000 years. A new study by the Institute of Astronomy in Zurich says that the "sun is more active now than it has been at anytime in the previous 1,000 years." Related?
Sunspots have been monitored on the Sun since 1610, shortly after the invention of the telescope. They provide the longest-running direct measurement of our star’s activity.
The variation in sunspot numbers has revealed the Sun’s 11-year cycle of activity as well as other, longer-term changes.
In particular, it has been noted that between about 1645 and 1715, few sunspots were seen on the Sun’s surface.
This period is called the Maunder Minimum after the English astronomer who studied it.
It coincided with a spell of prolonged cold weather often referred to as the "Little Ice Age". Solar scientists strongly suspect there is a link between the two events – but the exact mechanism remains elusive….
But the most striking feature, he says, is that looking at the past 1,150 years the Sun has never been as active as it has been during the past 60 years.
Over the past few hundred years, there has been a steady increase in the numbers of sunspots, a trend that has accelerated in the past century, just at the time when the Earth has been getting warmer.
The data suggests that changing solar activity is influencing in some way the global climate causing the world to get warmer.
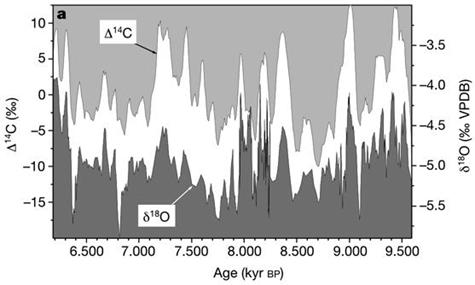
We can look at solar output over large time frames by looking at the production of carbon-14 (less is produced in years of high solar activity, and vice versa). The analysis below used the ratio of oxygen isotopes in the stalagmites to estimate the water temperature at the time they were formed. The result is an interesting correlation between solar activity and a global temperature proxy over a long time-scale (Graph from Neff et al., 2001):
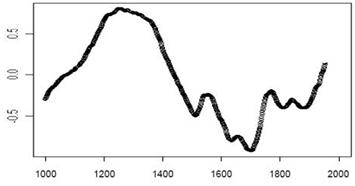
Over the last 1000 years, we see that (again using a reversed scale of C14 as a proxy) solar activity is highly correlated with long term temperature trends (I have used the pre-Mann chart, because while it may over-emphasize the Medieval Warm Period, I still think such a period existed).
Solar Output Anomaly

Temperature Anomaly
Look at the following reconstruction data by Judith Lean of the Naval Research Library and charted from her data at NOAA by Junkscience.com shows that interestingly, the sun’s output does appear to be higher today than they have been in many, perhaps hundreds of years
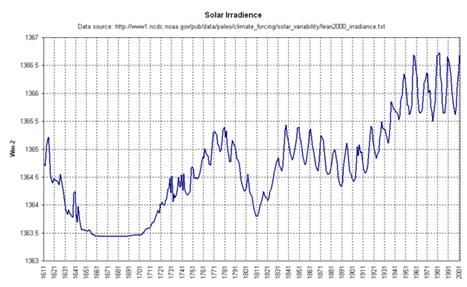
Would such increased activity be expected to result in higher Earth temperatures? I don’t know, and there are some issues one has to be careful with on this chart. Most importantly the scaling: While the shape of the curve looks a lot like the temperature trend over the last 400 years, note that the entire variation from the low to the high point is only about 0.25% – the scaling makes it look more dramatic. Of course, the same could be said for global temperature, where a half degree C temperature increase on an absolute Kelvin scale would only be about 0.17%, so an argument can be made that on a percentage basis, this change in irradiance is about the same order of magnitude as our change in temperature. A more sophisticated comparison might say that since black body radiation is related to absolute temperature to the fourth power, .25% increase in irradiance would be expected to heat the Earth by .06%.
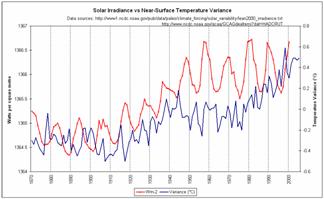
The chart on the above left compares the recent temperature anomaly to solar irradiance, while the chart on the right compares it to CO2 concentrations. Neither is a beautiful fit (and one may have to include aerosols in either scenario to account for 1970’s cooling) but solar irradiance seems at least as good as that of CO2. Remember, the IPCC shows the world cooling due to solar effects during the same time the red solar irradiance line is peaking.
Recently Alexander et. al. in have done some very comprehensive work relating solar irradiance and rainfall. The study posits that one of the reasons for less than perfect fit of sunspot and irradiance data with temperature is that the Sun actually works on a 21 year cycle when the sunspot cycle is combined with the cyclical wobble of the Suns motion through space. The study concluded:
The Intergovernmental Panel on Climate Change (IPCC) (2001) dismisses the view that solar activity has a meaningful influence on global climate. The basis for this view is that variations in the receipt of solar activity are too small to account for variations in the climatic responses. These variations were determined from satellite and other observations. What the IPCC scientists failed to appreciate is that changes in the level of solar radiation received on earth are amenable to precise calculation. The variations are well in excess of the IPCC value of +0,3 Wm–2 quoted earlier.
One of the interesting things about solar output is that, if it is really higher, we should see effects on other planets, not just on Earth. And, in fact, a lot of evidence has been pouring in over the last 5 years from astronomers (not climate guys) that the rest of the solar system has been warming dramatically.
Take Mars, for example. Mar’s ice caps have been melting and diminishing since NASA’s Mars Global Surveyor and Odyssey started to measure them around 2002.
Changes in the red spot on Jupiter seem to be a sign of warming temperatures. And Neptunes moon Triton is warming. We have to be careful with how we draw conclusions on these outer planets, since their “year” is so long, seasonal changes can last decades.
As seen in Figure 1, Neptune has been getting brighter since around 1980; furthermore, infrared measurements of the planet since 1980 show that the planet has been warming steadily from 1980 to 2004. As they say on Neptune, global warming has become an inconvenient truth. But with no one to blame, Hammel and Lockwood explored how variations in the output of the Sun might control variations in the brightness of Neptune.
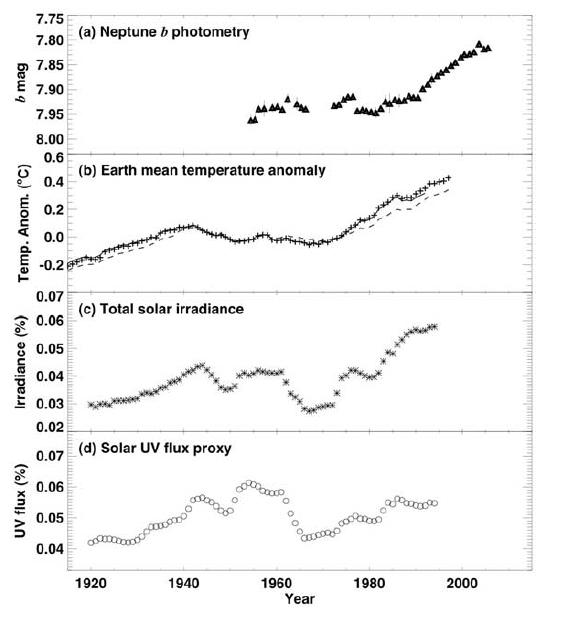
Figure 1 (a) represents the corrected visible light from Neptune from 1950 to 2006; (b) shows the temperature anomalies of the Earth; (c) shows the total solar irradiance as a percent variation by year; (d) shows the ultraviolet emission from the Sun (Source: Hammel and Lockwood (2007)).
What would seem so simple statistically is complicated by the degrees of freedom in the various time series which is related to the serial correlation in the data (e.g., next year’s value is highly dependent on this year’s value). Nonetheless, they find that the correlation coefficient between solar irradiance and Neptune’s brightness is near 0.90 (1.00 is perfect). The same relationship is found between the Earth’s temperature anomalies and the solar output. Hammel and Lockwood note “In other words, the Earth temperature values are as well correlated with solar irradiance (r = 0.89) as they are with Neptune’s blue brightness (|r| > 0.90), assuming a 10-year lag of the Neptune values.” The temporal lag is needed to account for the large mass of Neptune that would require years to adjust to any changes in solar output.
Hammel and Lockwood conclude that “In summary, if Neptune’s atmosphere is indeed responding to some variation in solar activity in a manner similar to that of the Earth albeit with a temporal lag” then “Neptune may provide an independent (and extraterrestrial) locale for studies of solar effects on planetary atmospheres.”
More on the sun’s variance and climate change here.
Cosmic Rays
One of the problems with irradiance as a driver for climate change is that though the changes seem to be fairly well correlated with the temperature anomaly, many scientists think the magnitude is too small to totally account for temperature changes. It is ironic that AGW supporters use this as a refutation of the sun’s effect, since they have exactly the same problem with CO2, and must posit huge positive feedback loops to justify their forecasts.
A second, newer theory has emerged as to a potential second warming effect of solar output. To understand it, we have to start with clouds. For those that don’t live in a hot climate like I do here in Phoenix, I will give everyone a bit of background – clouds cool things off. Ok, as with everything in climate, things are actually far more complicated – high clouds can sometimes cause warming, and nighttime clouds can actually slow cooling. Never-the-less, in general, cloudcover cools things off by blocking out and reflecting the sun’s energy.
Clouds are in fact such a strong cooling force that is has been estimated by several sources (Theodor Landscheidt, 1998) that having clouds cover 1% more of the Earth’s surface would cancel the heating effect of a doubling of CO2. In fact, it was one of my criticisms earlier that AGW theory seems overly intent on finding positive feedback loops, while not considering negative feedbacks seriously enough – one such potential negative feedback is that on a warmer Earth, more water is evaporated into clouds, in turn cooling things back off.
But recently, an interesting new theory on cloud formation has emerged. In short, it holds that cosmic rays, which are the high energy particles that arrive at Earth from supernovas, spur cloud formation by ionizing air molecules that act as seeds for water condensation and cloud formation. This sounds wild, but really no wilder than warming by a gas (CO2) that makes up a near trivial portion of the atmosphere. Like CO2 warming, this effect has been observed in various laboratory chambers. But is it really a measurable driver of climate?
Henrik Svensmark and Eigil Fris-Christensen looked at historic data on cloud cover and cosmic ray incidence, from various measuring points. Their data was extended and refined by Shiva in 2005.
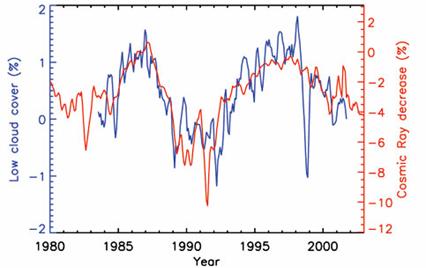
So what changes cosmic ray flux to the Earth? The biggest influence is the sun. When the sun’s output is high, cosmic rays are prevented from hitting the Earth, and vice versa. So high solar activity corresponds to low cosmic ray flux and therefore lower cloud formation and higher temperatures.
While the link between solar irradiance levels and warming is pretty straight forward, the cosmic ray cloud formation proposition is still in its infancy. Those of us who criticize AGW supporters for running past the evidence on CO2 should not make the same mistake on cosmic rays, and movies such as The Global Warming Swindle have gone too far in portraying this alternate theory as fact.
Man’s Land Use
Recently, Roger Pielke has done a substantial amount of research on a different type of anthropogenic forcing. Specifically, he has hypothesized that man’s changing patterns of land use can be a substantial driver of regional climate, including temperature and even more particularly, precipitation. For example, clearing relatively dry land and replacing it with irrigated agriculture substantially changes to the local heat balance, not the least by increasing humidity. Dr. Pielke explains summarizes the consequences on his web site:
Humans are significantly altering the global climate, but in a variety of diverse ways beyond the radiative effect of carbon dioxide. The IPCC assessments have been too conservative in recognizing the importance of these human climate forcings as they alter regional and global climate. These assessments have also not communicated the inability of the models to accurately forecast the spread of possibilities of future climate. The forecasts, therefore, do not provide any skill in quantifying the impact of different mitigation strategies on the actual climate response
that would occur.
The table of contents for the rest of this paper, A Layman’s Guide to Anthropogenic Global Warming (AGW) is here. Free pdf of this Climate Skepticism paper is here and print version is sold at cost here.