Explaining the Flaw in Kevin Drum’s (and Apparently Science Magazine’s) Climate Chart

Cross-Posted from Coyoteblog

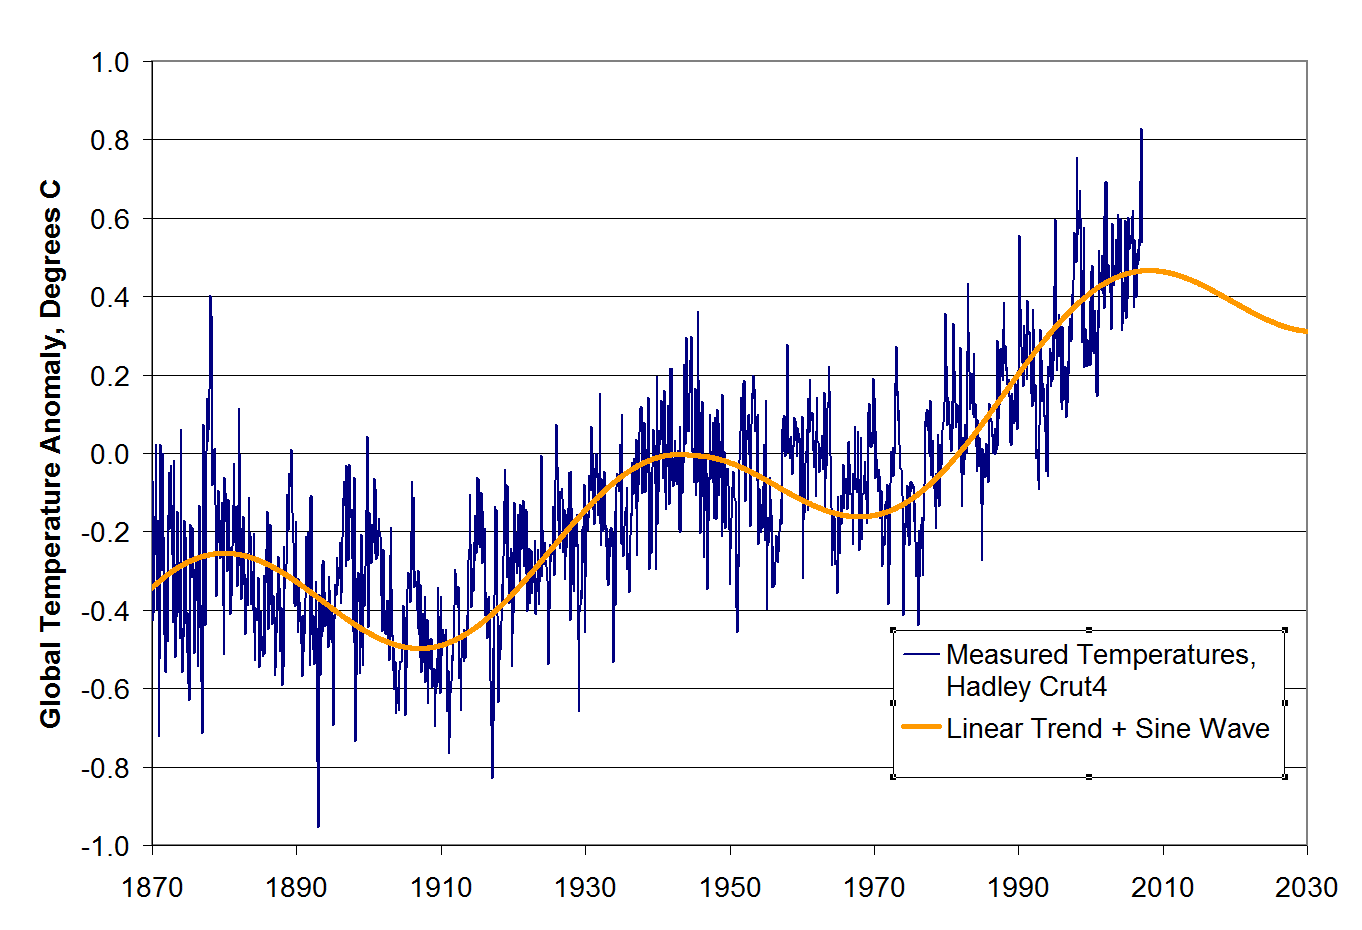
I won’t repeat the analysis, you need to see it here.  Here is the chart in question:

la-sci-climate-warming

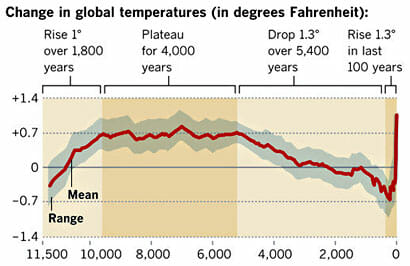
My argument is that the smoothing and relatively low sampling intervals in the early data very likely mask variations similar to what we are seeing in the last 100 years — ie they greatly exaggerate the smoothness of history (also the grey range bands are self-evidently garbage, but that is another story).

Drum’s response was that “it was published in Science.”  Apparently, this sort of appeal to authority is what passes for data analysis in the climate world.

Well, maybe I did not explain the issue well.  So I found a political analysis that may help Kevin Drum see the problem.  This is from an actual blog post by Dave Manuel (this seems to be such a common data analysis fallacy that I found an example on the first page of my first Google search).  It is an analysis of average GDP growth by President.  I don’t know this Dave Manuel guy and can’t comment on the data quality, but let’s assume the data is correct for a moment.  Quoting from his post:

Here are the individual performances of each president since 1948:

1948-1952 (Harry S. Truman, Democrat), +4.82%
1953-1960 (Dwight D. Eisenhower, Republican), +3%
1961-1964 (John F. Kennedy / Lyndon B. Johnson, Democrat), +4.65%
1965-1968 (Lyndon B. Johnson, Democrat), +5.05%
1969-1972 (Richard Nixon, Republican), +3%
1973-1976 (Richard Nixon / Gerald Ford, Republican), +2.6%
1977-1980 (Jimmy Carter, Democrat), +3.25%
1981-1988 (Ronald Reagan, Republican), 3.4%
1989-1992 (George H. W. Bush, Republican), 2.17%
1993-2000 (Bill Clinton, Democrat), 3.88%
2001-2008 (George W. Bush, Republican), +2.09%
2009 (Barack Obama, Democrat), -2.6%

Let’s put this data in a chart:

click to enlarge


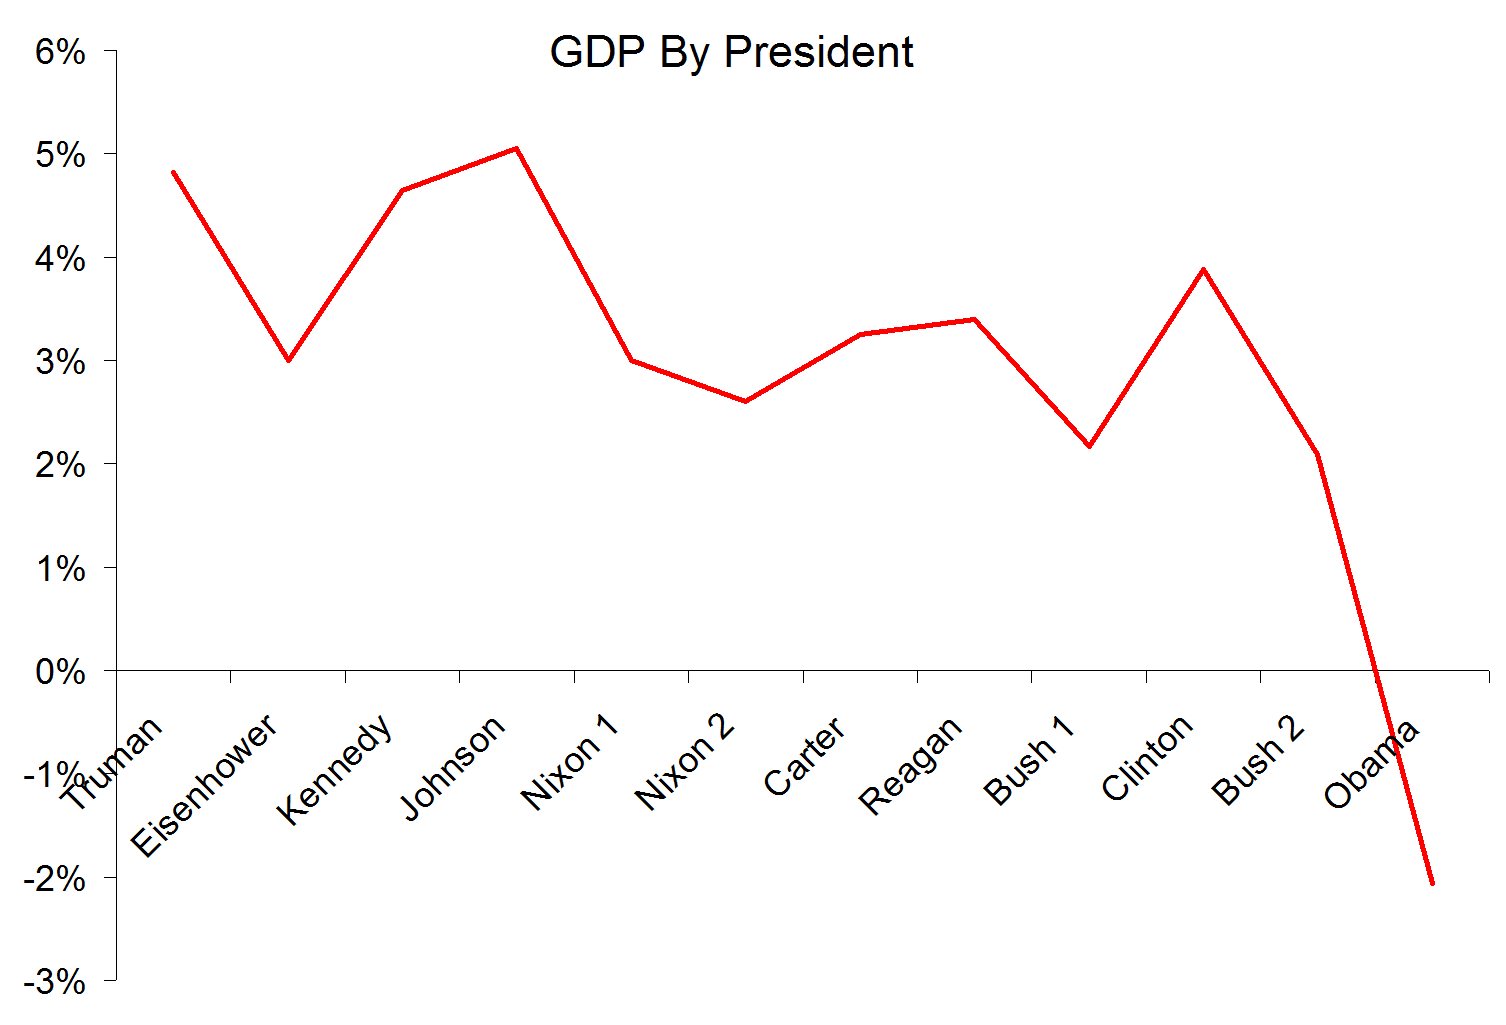
Look, a hockey stick , right?   Obama is the worst, right?

In fact there is a big problem with this analysis, even if the data is correct.  And I bet Kevin Drum can get it right away, even though it is the exact same problem as on his climate chart.

The problem is that a single year of Obama’s is compared to four or eight years for other presidents.  These earlier presidents may well have had individual down economic years – in fact, Reagan’s first year was almost certainly a down year for GDP.  But that kind of volatility is masked because the data points for the other presidents represent much more time, effectively smoothing variability.

Now, this chart has a difference in sampling frequency of 4-8x between the previous presidents and Obama.  This made a huge difference here, but it is a trivial difference compared to the 1 million times greater sampling frequency of modern temperature data vs. historical data obtained by looking at proxies (such as ice cores and tree rings).  And, unlike this chart, the method of sampling is very different across time with temperature – thermometers today are far more reliable and linear measurement devices than trees or ice.  In our GDP example, this problem roughly equates to trying to compare the GDP under Obama (with all the economic data we collate today) to, say, the economic growth rate under Henry the VIII.  Or perhaps under Ramses II.   If I showed that GDP growth in a single month under Obama was less than the average over 66 years under Ramses II, and tried to draw some conclusion from that, I think someone might challenge my analysis.  Unless of course it appears in Science, then it must be beyond question.

If You Don’t Like People Saying That Climate Science is Absurd, Stop Publishing Absurd Un-Scientific Charts

Reprinted from Coyoteblog

science a “myth”.  As is usual for global warming supporters, he wraps himself in the mantle of science while implying that those who don’t toe the line on the declared consensus are somehow anti-science.

Readers will know that as a lukewarmer, I have as little patience with outright CO2 warming deniers as I do with those declaring a catastrophe  (for my views read this and this).  But if you are going to simply be thunderstruck that some people don’t trust climate scientists, then don’t post a chart that is a great example of why people think that a lot of global warming science is garbage.  Here is Drum’s chart:

la-sci-climate-warming

The problem is that his chart is a splice of multiple data series with very different time resolutions.  The series up to about 1850 has data points taken at best every 50 years and likely at 100-200 year or more intervals.  It is smoothed so that temperature shifts less than 200 years or so in length won’t show up and are smoothed out.

In contrast, the data series after 1850 has data sampled every day or even hour.  It has a sampling interval 6 orders of magnitude (over a million times) more frequent.  It by definition is smoothed on a time scale substantially shorter than the rest of the data.

In addition, these two data sets use entirely different measurement techniques.  The modern data comes from thermometers and satellites, measurement approaches that we understand fairly well.  The earlier data comes from some sort of proxy analysis (ice cores, tree rings, sediments, etc.)  While we know these proxies generally change with temperature, there are still a lot of questions as to their accuracy and, perhaps more importantly for us here, whether they vary linearly or have any sort of attenuation of the peaks.  For example, recent warming has not shown up as strongly in tree ring proxies, raising the question of whether they may also be missing rapid temperature changes or peaks in earlier data for which we don’t have thermometers to back-check them (this is an oft-discussed problem called proxy divergence).

The problem is not the accuracy of the data for the last 100 years, though we could quibble this it is perhaps exaggerated by a few tenths of a degree.  The problem is with the historic data and using it as a valid comparison to recent data.  Even a 100 year increase of about a degree would, in the data series before 1850, be at most a single data point.  If the sampling is on 200 year intervals, there is a 50-50 chance a 100 year spike would be missed entirely in the historic data.  And even if it were in the data as a single data point, it would be smoothed out at this data scale.

Do you really think that there was never a 100-year period in those last 10,000 years where the temperatures varied by more than 0.1F, as implied by this chart?  This chart has a data set that is smoothed to signals no finer than about 200 years and compares it to recent data with no such filter.  It is like comparing the annualized GDP increase for the last quarter to the average annual GDP increase for the entire 19th century.   It is easy to demonstrate how silly this is.  If you cut the chart off at say 1950, before much anthropogenic effect will have occurred, it would still look like this, with an anomalous spike at the right (just a bit shorter).  If you believe this analysis, you have to believe that there is an unprecedented spike at the end even without anthropogenic effects.

There are several other issues with this chart that makes it laughably bad for someone to use in the context of arguing that he is the true defender of scientific integrity

  • The grey range band is if anything an even bigger scientific absurdity than the main data line.  Are they really trying to argue that there were no years, or decades, or even whole centuries that never deviated from a 0.7F baseline anomaly by more than 0.3F for the entire 4000 year period from 7500 years ago to 3500 years ago?  I will bet just about anything that the error bars on this analysis should be more than 0.3F, much less the range of variability around the mean.  Any natural scientist worth his or her salt would laugh this out of the room.  It is absurd.  But here it is presented as climate science in the exact same article that the author expresses dismay that anyone would distrust climate science.
  • A more minor point, but one that disguises the sampling frequency problem a bit, is that the last dark brown shaded area on the right that is labelled “the last 100 years” is actually at least 300 years wide.  Based on the scale, a hundred years should be about one dot on the x axis.  This means that 100 years is less than the width of the red line, and the last 60 years or the real anthropogenic period is less than half the width of the red line.  We are talking about a temperature change whose duration is half the width of the red line, which hopefully gives you some idea why I say the data sampling and smoothing processes would disguise any past periods similar to the most recent one.

Update:  Kevin Drum posted a defense of this chart on Twitter.  Here it is:  “It was published in Science.”   Well folks, there is climate debate in a nutshell.   An 1000-word dissection of what appears to be wrong with a particular analysis retorted by a five-word appeal to authority.

Update On My Climate Model (Spoiler: It’s Doing a Lot Better than the Pros)

Cross posted from Coyoteblog

In this post, I want to discuss my just-for-fun model of global temperatures I developed 6 years ago.  But more importantly, I am going to come back to some lessons about natural climate drivers and historic temperature trends that should have great relevance to the upcoming IPCC report.

In 2007, for my first climate video, I created an admittedly simplistic model of global temperatures.  I did not try to model any details within the climate system.  Instead, I attempted to tease out a very few (it ended up being three) trends from the historic temperature data and simply projected them forward.  Each of these trends has a logic grounded in physical processes, but the values I used were pure regression rather than any bottom up calculation from physics.  Here they are:

  • A long term trend of 0.4C warming per century.  This can be thought of as a sort of base natural rate for the post-little ice age era.
  • An additional linear trend beginning in 1945 of an additional 0.35C per century.  This represents combined effects of CO2 (whose effects should largely appear after mid-century) and higher solar activity in the second half of the 20th century  (Note that this is way, way below the mainstream estimates in the IPCC of the historic contribution of CO2, as it implies the maximum historic contribution is less than 0.2C)
  • A cyclic trend that looks like a sine wave centered on zero (such that over time it adds nothing to the long term trend) with a period of about 63 years.  Think of this as representing the net effect of cyclical climate processes such as the PDO and AMO.

Put in graphical form, here are these three drivers (the left axis in both is degrees C, re-centered to match the centering of Hadley CRUT4 temperature anomalies).  The two linear trends:

click to enlarge


And the cyclic trend:

click to enlarge

These two charts are simply added and then can be compared to actual temperatures.  This is the way the comparison looked in 2007 when I first created this “model”

click to enlarge

The historic match is no great feat.  The model was admittedly tuned to match history (yes, unlike the pros who all tune their models, I admit it).  The linear trends as well as the sine wave period and amplitude were adjusted to make the fit work.

However, it is instructive to note that a simple model of a linear trend plus sine wave matches history so well, particularly since it assumes such a small contribution from CO2 (yet matches history well) and since in prior IPCC reports, the IPCC and most modelers simply refused to include cyclic functions like AMO and PDO in their models.  You will note that the Coyote Climate Model was projecting a flattening, even a decrease in temperatures when everyone else in the climate community was projecting that blue temperature line heading up and to the right.

So, how are we doing?  I never really meant the model to have predictive power.  I built it just to make some points about the potential role of cyclic functions in the historic temperature trend.  But based on updated Hadley CRUT4 data through July, 2013, this is how we are doing:

click to enlarge


Not too shabby.  Anyway, I do not insist on the model, but I do want to come back to a few points about temperature modeling and cyclic climate processes in light of the new IPCC report coming soon.

The decisions of climate modelers do not always make sense or seem consistent.  The best framework I can find for explaining their choices is to hypothesize that every choice is driven by trying to make the forecast future temperature increase as large as possible.  In past IPCC reports, modelers refused to acknowledge any natural or cyclic effects on global temperatures, and actually made statements that a) variations in the sun’s output were too small to change temperatures in any measurable way and b) it was not necessary to include cyclic processes like the PDO and AMO in their climate models.

I do not know why these decisions were made, but they had the effect of maximizing the amount of past warming that could be attributed to CO2, thus maximizing potential climate sensitivity numbers and future warming forecasts.  The reason for this was that the IPCC based nearly the totality of their conclusions about past warming rates and CO2 from the period 1978-1998.  They may talk about “since 1950”, but you can see from the chart above that all of the warming since 1950 actually happened in that narrow 20 year window.  During that 20-year window, though, solar activity, the PDO and the AMO were also all peaking or in their warm phases.  So if the IPCC were to acknowledge that any of those natural effects had any influence on temperatures, they would have to reduce the amount of warming scored to CO2 between 1978 and 1998 and thus their large future warming forecasts would have become even harder to justify.

Now, fast forward to today.  Global temperatures have been flat since about 1998, or for about 15 years or so.  This is difficult to explain for the IPCC, since about none of the 60+ models in their ensembles predicted this kind of pause in warming.  In fact, temperature trends over the last 15 years have fallen below the 95% confidence level of nearly every climate model used by the IPCC.  So scientists must either change their models (eek!) or else they must explain why they still are correct but missed the last 15 years of flat temperatures.

The IPCC is likely to take the latter course.  Rumor has it that they will attribute the warming pause to… ocean cycles and the sun (those things the IPCC said last time were irrelevant).  As you can see from my model above, this is entirely plausible.  My model has an underlying 0.75C per century trend after 1945, but even with this trend actual temperatures hit a 30-year flat spot after the year 2000.   So it is entirely possible for an underlying trend to be temporarily masked by cyclical factors.

BUT.  And this is a big but.  You can also see from my model that you can’t assume that these factors caused the current “pause” in warming without also acknowledging that they contributed to the warming from 1978-1998, something the IPCC seems loath to do.  I do not know how the ICC is going to deal with this.  I hate to think the worst of people, but I do not think it is beyond them to say that these factors offset greenhouse warming for the last 15 years but did not increase warming the 20 years before that.

We shall see.  To be continued….

Climate Goundhog Day

I posted something like this over at my other blog but I suppose I should post it here as well.  Folks ask me why I have not been blogging much here on climate, and the reason is that is has just gotten too repetitive.  It is like the movie Groundhog Day, with the same flawed studies being refuted in the same ways.  Or, if you want another burrowing mammal analogy, being a climate skeptic has become a giant game of Wack-a-Mole, with each day bringing a new flawed argument from alarmist that must be refuted.  But we never accumulate any score — skeptics have pretty much killed Gore’s ice core analysis, the hockey stick, the myth that CO2 is reducing snows on Kilamanjaro, Gore’s 20- feet of sea rise — the list goes on an on.  But we get no credit — we are still the ones who are supposedly anti-science.

This is a hobby, and not even my main hobby, so I have decided to focus on what I enjoy best about the climate debate, and that is making live presentations.  To this end, you will continue to see posts here with updated presentations and videos, and possibly a new analysis or two as I find better ways to present the material (by the way, if you have a large group, I am happy to come speak — I do not charge a speaker fee and can often pay for the travel myself).

However, while we are on the subject of climate Groundhog Day (where every day repeats itself over and over), let me tell you in advance what stories skeptic sites like WUWT and Bishop Hill and Climate Depot will be running in the coming months on the IPCC.  I can predict these with absolute certainty because they are the same stories run on the last IPCC report, and I don’t expect those folks at the IPCC to change their stripes.  So here are your future skeptic site headlines:

  1. Science sections of recent IPCC report were forced to change to fit the executive summary written by political appointees
  2. The recent IPCC report contains a substantial number of references to non-peer reviewed gray literature
  3. In the IPCC report, a couple of studies that fend off key skeptic attacks either have not yet even been published or were included despite being released after the cut off date set for studies to be included in the report
  4. In several sections of the recent IPCC report, the lead author ignored most other studies and evidence on the matter at hand and based their chapter mostly on their own research
  5. In its conclusions, the IPCC expresses absolute confidence in a statement about anthropogenic warming so vague that most skeptics might agree with the proposition.  Media then reported this as 97% confidence in 5 degrees of warming per century and 20 feet of sea rise
  6. The hockey stick has been reworked and is still totally flawed
  7. Non-Co2 causes of weather and weather related effects (e.g the sun or anthropocentric contributions like soot) are downplayed or ignored in the most recent IPCC report
  8. The words “urban heat island” appear nowhere in the IPCC report.  There is no consideration of the quality of the surface temperature record, its measurement, or the manual adjustments made to it.
  9. Most of the key studies in the IPCC report have not archived their data and refuse to release their data or software code to any skeptic for replication

Oh, I suppose it will not be all Groundhog Day.  I will predict a new one.  The old headlines were “IPCC ignores ocean cycles as partial cause for 1978-1998 warming”.  This report will be different.  Now stories will read for the new report, “IPCC blames warming hiatus on cooling from ocean cycles, but says ocean cycles have nothing to do with earlier warming”.

Amherst, MA Presentation, March 7

I will be rolling out version 3.0 of my presentation on climate that has already been around the Internet and back a couple of times.  Called “Don’t Panic:  The Science of the Climate Skeptic Position”, it will be given at 7PM in the Pruyne Lecture Hall at Amherst College on March 7, 2013.  Come by if you are in the area.

Topics include:

  • What does it mean when people say “97% of scientists agree with global warming?”   This statement turns out to be substantially less powerful when one understands the propositions actually tested.
  • The greenhouse gas effect of CO2 is a fact (did I surprise you?) but it is a second, unproven theory of strong positive feedbacks in the climate that causes the hypothesized catastrophe.
  • The world has indeed warmed over the last century, but not enough to be consistent with catastrophic forecasts, and not all due to CO2
  • While good science is being done, the science behind knock-on effects of global warming (e.g. global warming causedSandy) is often non-existent or embarrassingly bad.  Too often, the media is extrapolating from single data points
  • The “precautionary principle” ignores real negative effects of carbon rationing, particularly in lesser developed countries.

Speaker Pledge

The tone of the global warming debate is often terrible (on both sides).  The speaker will assume those who disagree are persons of goodwill.   The speaker will not resort to ad hominem attacks or discussion of funding sources and motivations.