Government treaties and legislation will of necessity increase the cost of energy substantially. It will also indirectly increase the cost of food and other staples, as fertilizer, equipment, and transportation costs rise. This is not to mention the substantial rise in food costs that will continue as long as governments continue their misguided efforts to promote and subsidize food-based ethanol as a global warming solution.
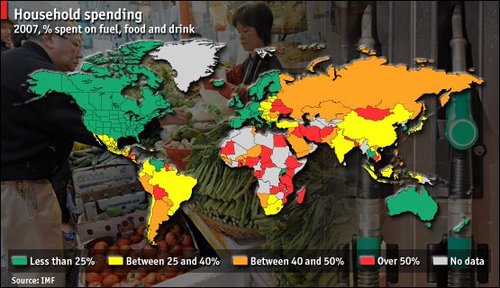
I found the map below in another context at economist Mark Perry’s site. It shows the percentage of the average person’s income that is spent on food, fuel, and drink, with low percentages in green and high percentages in red. However, this could easily be a map of the pain created by CO2 abatement efforts, with the most pain felt in red and the least in green. In fact, this map actually underestimates the pain in yellow-red areas, as is does not factor in the lost development potential and thus lost future income from CO2 abatement efforts.
Biofuels have caused a 75 per cent increase in world food prices, a new report suggests.
The rise is far greater than previous estimates including a US Government claim that plant-derived fuels contribute less than three per cent to food price hikes.
According to reports last night, a confidential World Bank document indicates the true extent of the effect of biofuels on prices at a crucial time in the world’s negotiations on biofuel policy.
Rising food prices have been blamed for pushing 100 million people beneath the poverty line. The confidential report, based on a detailed economic analysis of the effect of biofuels, will put pressure on the American and European governments, which have turned to biofuels in attempts to reduce the greenhouse gases associated with fossil fuels and to reduce their reliance on oil imports.
The report says: "Without the increase in biofuels, global wheat and maize stocks would not have declined appreciably and price increases due to other factors would have been moderate."


There is a lot of frantic hand waving over this issue but not much of substance. Looking at raw numbers, it is clear that increase in Chinese meat-eating spurred demand for grain (livestock feed) more than biofuels by a factor of at least 10. The World Bank piece looks like a political hit job.
I’m not so sure this is an accurate depiction of the scale economics around AGW. Many of the full impacts of these foolish abatement programs will be hidden, and a few will take multiple years to occur (increase in global mortality rates, lower living standards, etc.).
Pretty cookie-cutter in its analysis depth, but definitely on par with fraudulent climate “science” statements like “increasing severity of global-warming caused storm damage results in costs of wind speed cubed” or other nonsense.
We’re getting pretty close to the point where 1) the actual science is collapsing around this fake problem, and 2) any economic impact will be far less than the draconian measures proposed by these socialist thieves to “remedy” it.
In other words, even if AGW is real, I don’t care, and neither should you, nor should we do anything about it.
Hmm, kind of odd how I have never seen this headline, which would be an expected if not appropriate response to such a map:
“Blacks, Latinos, and Arabs hurt most by biofuels.”
Given the distribution of the red and orange per continent, and the total amount of people per nation per continent affected, this would seem to be a headline screaming for attention. But of course biofuels are part of the pet project of world dominan…er, I mean a ‘better tomorrow’ for everybody, and as such cannot be questioned.