Tag Archives: climate models

Perils of Modeling Complex Systems

I thought this article in the NY Times about the failure of models to accurately predict the progression of swine flu cases was moderately instructive.

In the waning days of April, as federal officials were declaring a public health emergency and the world seemed gripped by swine flu panic, two rival supercomputer teams made projections about the epidemic that were surprisingly similar — and surprisingly reassuring. By the end of May, they said, there would be only 2,000 to 2,500 cases in the United States.

May’s over. They were a bit off.

On May 15, the Centers for Disease Control and Prevention estimated that there were “upwards of 100,000” cases in the country, even though only 7,415 had been confirmed at that point.

The agency declines to update that estimate just yet. But Tim Germann, a computational scientist who worked on a 2006 flu forecast model at Los Alamos National Laboratory, said he imagined there were now “a few hundred thousand” cases.

We can take at least two lessons from this:

  • Accurately modeling complex systems is really, really hard.  We may have hundreds of key variables, and changes in starting values or assumed correlation coefficients between these variables can make enormous differences in model results.
  • Very small changes in assumptions about processes that compound or have exponential growth make enormous differences in end results.  I think most people grossly underestimate this effect.  Take a process that starts at an arbitrary value of “100” and grows at some growth rate each period for 50 periods.    A growth rate of 1% per period yields an end value of  164.  A growth rate just 1 percentage point higher of 2% per period yields a final value of  269.    A growth rate of 3% yield a final value of 438.  In this case, if we miss the growth rate by just a couple of percentage points, we miss the end value by a factor of three!

Bringing this back to climate, we must understand that the problem of forecasting disease growth rates is grossly, incredibly more simple than forecasting future temperatures.  These guys missed the forecast my miles of a process that is orders of magnitude more amenable to forecasting than is climate.  But I am encouraged by this:

Both professors said they would use the experience to refine their models for the future.

If only climate scientists took this approach to new observations.

It’s Not Zero

I have been meaning to link to this post for a while, but the Reference Frame, along with Roy Spencer, makes a valuable point I have also made for some time — the warming effect from man’s CO2 is not going to be zero.  The article cites approximately the same number I have used in my work and that was used by the IPCC:  absent feedback and other second order effects, the earth should likely warm about 1.2C from a doubling of CO2.

The bare value (neglecting rain, effects on other parts of the atmosphere etc.) can be calculated for the CO2 greenhouse effect from well-known laws of physics: it gives 1.2 °C per CO2 doubling from 280 ppm (year 1800) to 560 ppm (year 2109, see below). The feedbacks may amplify or reduce this value and they are influenced by lots of unknown complex atmospheric effects as well as by biases, prejudices, and black magic introduced by the researchers.

A warming in the next century of 0.6 degrees, or about the same warming we have seen in the last century, is a very different prospect, demanding different levels of investment, than typical forecasts of 5-10 degrees or more of warming from various alarmists.

How we get from a modest climate sensitivity of 1.2 degrees to catastrophic forecasts is explained in this video:

The Dividing Line Between Nuisance and Catastrophe: Feedback

I have written for quite a while that the most important issue in evaluating catastrophic global warming forecasts is feedback.  Specifically, is the climate dominated by positive feedbacks, such that small CO2-induced changes in temperatures are multiplied many times, or even hit a tipping point where temperatures run away?  Or is the long-term stable system of climate more likely dominated by flat to negative feedback, as are most natural physical systems?  My view has always been that the earth will warm at most a degree for a doubling of CO2 over the next century, and may warm less if feedbacks turn out to be negative.

I am optimistic that this feedback issue may finally be seeing the light of day.  Here is Professor William Happer of Princeton in US Senate testimony:

There is little argument in the scientific community that a direct effect of doubling the CO2 concentration will be a small increase of the earth’s temperature — on the order of one degree. Additional increments of CO2 will cause relatively less direct warming because we already have so much CO2 in the atmosphere that it has blocked most of the infrared radiation that it can. It is like putting an additional ski hat on your head when you already have a nice warm one below it, but your are only wearing a windbreaker. To really get warmer, you need to add a warmer jacket. The IPCC thinks that this extra jacket is water vapor and clouds.

Since most of the greenhouse effect for the earth is due to water vapor and clouds, added CO2 must substantially increase water’s contribution to lead to the frightening scenarios that are bandied about. The buzz word here is that there is “positive feedback.” With each passing year, experimental observations further undermine the claim of a large positive feedback from water. In fact, observations suggest that the feedback is close to zero and may even be negative. That is, water vapor and clouds may actually diminish the already small global warming expected from CO2, not amplify it. The evidence here comes from satellite measurements of infrared radiation escaping from the earth into outer space, from measurements of sunlight reflected from clouds and from measurements of the temperature the earth’s surface or of the troposphere, the roughly 10 km thick layer of the atmosphere above the earth’s surface that is filled with churning air and clouds, heated from below at the earth’s surface, and cooled at the top by radiation into space.

When the IPCC gets to a forecast of 3-5C warming over the next century (in which CO2 concentrations are expected to roughly double), it is in two parts.  As professor Happer relates, only about 1C of this is directly from the first order effects of more Co2.  This assumption of 1C warming for a doubling of Co2 is relatively stable across both scientists and time, except that the IPCC actually reduced this number a bit between their 3rd and 4th reports.

They get from 1C to 3C-5C with feedback.  Here is how feedback works.

Lets say the world warms 1 degree.  Lets also assume that the only feedback is melting ice and albedo, and that for every degree of warming, the lower albedo from melted ice reflecting less sunlight back into space adds another 0.1 degree of warming.  But this 0.1 degree extra warming would in turn melt a bit more ice, which would result in 0.01 degree 3rd order warming.  So the warming from an initial 1 degree with such 10% feedback would be 1+0.1+0.01+0.001 …. etc.   This infinite series can be calculated as   dT * (1/(1-g))  where dT is the initial first order temperature change (in this case 1C) and g is the percentage that is fed back (in this case 10%).  So a 10% feedback results in a gain or multiplier of the initial temperature effect of 1.11 (more here).

So how do we get a multiplier of 3-5 in order to back into the IPCC forecasts?  Well, using our feedback formula backwards and solving for g, we get feedback percents of 67% for a 3 multiplier and 80% for a 5 multiplier.  These are VERY high feedbacks for any natural physical system short of nuclear fission, and this issue is the main (but by no means only) reason many of us are skeptical of catastrophic forecasts.

[By the way, to answer past criticisms, I know that the models do not use this simplistic feedback methodology in their algorithms.  But no matter how complex the details are modeled, the bottom line is that somewhere in the assumptions underlying these models, a feedback percent of 67-80% is implicit]

For those paying attention, there is no reason that feedback should apply in the future but not in the past.  Since the pre-industrial times, it is thought we have increased atmospheric Co2 by 43%.  So, we should have seen, in the past, 43% of the temperature rise from a doubling, or 43% of 3-5C, which is 1.3C-2.2C.  In fact, this underestimates what we should have seen historically since we just did a linear interpolation.  But Co2 to temperature is a logarithmic diminishing return relationship, meaning we should see faster warming with earlier increases than with later increases.  Never-the-less, despite heroic attempts to posit some offsetting cooling effect which is masking this warming, few people believe we have seen any such historic warming, and the measured warming is more like 0.6C.  And some of this is likely due to the fact that the solar activity was at a peak in the late 20th century, rather than just Co2.

I have a video discussing these topics in more depth:

This is the bait and switch of climate alarmism.  When pushed into the corner, they quickly yell “this is all settled science,”  when in fact the only part that is fairly well agreed upon is the 1C of first order warming from a doubling.  The majority of the warming, the amount that converts the forecast from nuisance to catastrophe, comes from feedback which is very poorly understood and not at all subject to any sort of consensus.

A Cautionary Tale About Models Of Complex Systems

I have often written warming about the difficulty of modeling complex systems.  My mechanical engineering degree was focused on the behavior and modeling of dynamic systems.  Since then, I have spent years doing financial, business, and economic modeling.  And all that experienced has taught me humility, as well as given me a good knowledge of where modelers tend to cheat.

Al Gore has argued that we should trust long-term models, because Wall Street has used such models successfully for years  (I am not sure he has been using this argument lately, lol).  I was immediately skeptical of this statement.  First, Wall Street almost never makes 100-year bets based on models (they may be investing in 30-year securities, but the bets they are making are much shorter term).  Second, my understanding of Wall Street history is that lower Manhattan is littered with the carcasses of traders who bankrupted themselves following the hot model of the moment.  It is ever so easy to create a correlation model that seems to back-cast well.  But no one has ever created one that holds up well going forward.

A reader sent me this article about the Gaussian copula, apparently the algorithm that underlay the correlation models Wall Streeters used to assess mortgage security and derivative risk.

Wall Streeters have the exact same problem that climate modelers have.  There is a single output variable they both care about (security price for traders, global temperature for modelers).  This variable’s value changes in a staggeringly complex system full of millions of variables with various levels of cross-correlation.  The modelers challenge is to look at the historical data, and to try to tease out correlation factors between their output variable and all the other input variables in an environment where they are all changing.

The problem is compounded because some of the input variables move on really long cycles, and some move on short cycles.  Some of these move in such long cycles that we may not even recognize the cycle at all.  In the end, this tripped up the financial modelers — all of their models derived correlation factors from a long and relatively unbroken period of home price appreciation.  Thus, when this cycle started to change, all the models fell apart.

Li’s copula function was used to price hundreds of billions of dollars’ worth of CDOs filled with mortgages. And because the copula function used CDS prices to calculate correlation, it was forced to confine itself to looking at the period of time when those credit default swaps had been in existence: less than a decade, a period when house prices soared. Naturally, default correlations were very low in those years. But when the mortgage boom ended abruptly and home values started falling across the country, correlations soared.

I never criticize people for trying to do an analysis with the data they have.  If they have only 10 years of data, that’s as far as they can run the analysis.  However, it is then important that they recognize that their analysis is based on data that may be way too short to measure longer term trends.

As is typical when models go wrong, early problems in the model did not cause users to revisit their assumptions:

His method was adopted by everybody from bond investors and Wall Street banks to ratings agencies and regulators. And it became so deeply entrenched—and was making people so much money—that warnings about its limitations were largely ignored.

Then the model fell apart. Cracks started appearing early on, when financial markets began behaving in ways that users of Li’s formula hadn’t expected. The cracks became full-fledged canyons in 2008—when ruptures in the financial system’s foundation swallowed up trillions of dollars and put the survival of the global banking system in serious peril.

A couple of lessons I draw out for climate models:

  1. Limited data availability can limit measurement of long-term cycles.  This is particularly true in climate, where cycles can last hundreds and even thousands of years, but good reliable data on world temperatures is only available for our 30 years and any data at all for about 150 years.  Interestingly, there is good evidence that many of the symptoms we attribute to man-made global warming are actually part of climate cycles that go back long before man burned fossil fuels in earnest.  For example, sea levels have been rising since the last ice age, and glaciers have been retreating since the late 18th century.
  2. The fact that models hindcast well has absolutely no predictive power as to whether they will forecast well
  3. Trying to paper over deviations between model forecasts and actuals, as climate scientists have been doing for the last 10 years, without revisiting the basic assumptions of the model can be fatal.

A Final Irony

Do you like irony?  In the last couple of months, I have been discovering I like it less than I thought.  But here is a bit of irony for you anyway.  The first paragraph of Obama’s new budget read like this:

This crisis is neither the result of a normal turn of the business cycle nor an accident of history, we arrived at this point as a result of an era of profound irresponsibility that engulfed both private and public institutions from some of our largest companies’ executive suites to the seats of power in Washington, D.C.

As people start to deconstruct last year’s financial crisis, most of them are coming to the conclusion that the #1 bit of “irresponsibility” was the blind investment of trillions of dollars based on solely on the output of correlation-based computer models, and continuing to do so even after cracks appeared in the models.

The irony?  Obama’s budget includes nearly $700 billion in new taxes (via a cap-and-trade system) based solely on … correlation-based computer climate models that predict rapidly rising temperatures from CO2.  Climate models in which a number of cracks have appeared, but which are being ignored.

Postscript: When I used this comparison the other day, a friend of mine fired back that the Wall Street guys were just MBA’s, but the climate guys were “scientists” and thus presumably less likely to err.  I responded that I didn’t know if one group or the other was more capable (though I do know that Wall Street employs a hell of a lot of top-notch PhD’s).  But I did know that the financial consequences for Wall Street traders having the wrong model was severe, while the impact on climate modelers of being wrong was about zero.  So, from an incentives standpoint, I know who I would more likely bet on to try to get it right.

The Plug

I have always been suspicious of climate models, in part because I spent some time in college trying to model chaotic dynamic systems, and in part because I have a substantial amount of experience with financial modeling.   There are a number of common traps one can fall into when modeling any system, and it appears to me that climate modelers are falling into most of them.

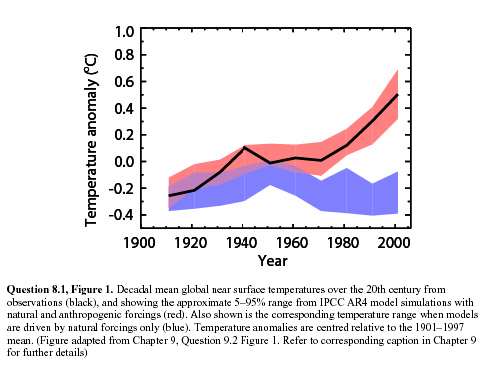
So a while back (before I even created this site) I was suspicious of this chart from the IPCC.  In this chart, the red is the “backcasting” of temperature history using climate models, the black line is the highly smoothed actuals, while the blue is a guess from the models as to what temperatures would have looked like without manmade forcings, particularly CO2.
ipcc1

As I wrote at the time:

I cannot prove this, but I am willing to make a bet based on my long, long history of modeling (computers, not fashion).  My guess is that the blue band, representing climate without man-made effects, was not based on any real science but was instead a plug.  In other words, they took their models and actual temperatures and then said “what would the climate without man have to look like for our models to be correct.”  There are at least four reasons I strongly suspect this to be true:

  1. Every computer modeler in history has tried this trick to make their models of the future seem more credible.  I don’t think the climate guys are immune.
  2. There is no way their models, with our current state of knowledge about the climate, match reality that well.
  3. The first time they ran their models vs. history, they did not match at all.  This current close match is the result of a bunch of tweaking that has little impact on the model’s predictive ability but forces it to match history better.  For example, early runs had the forecast run right up from the 1940 peak to temperatures way above what we see today.
  4. The blue line totally ignores any of our other understandings about the changing climate, including the changing intensity of the sun.  It is conveniently exactly what is necessary to make the pink line match history.  In fact, against all evidence, note the blue band falls over the century.  This is because the models were pushing the temperature up faster than we have seen it rise historically, so the modelers needed a negative plug to make the numbers look nice.

As you can see, the blue band, supposedly sans mankind, shows a steadily declining temperature. This never made much sense to me, given that, almost however you measure it, solar activity over the last half of the decade was stronger than the first half, but they show the natural forcings to be exactly opposite from what we might expect from this chart of solar activity as measured by sunspots (red is smoothed sunspot numbers, green is Hadley CRUT3 temperature).
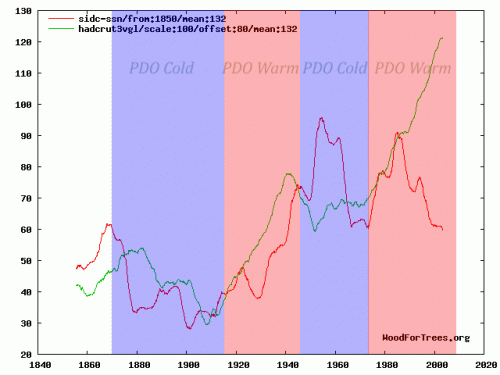
temp_spots_with_pdo

By the way, there is a bit of a story behind this chart.  It was actually submitted by a commenter to this site of the more alarmist persuasion  (without the PDO bands), to try to debunk the link between temperature and the sun  (silly rabbit – the earth’ s temperature is not driven by the sun, but by parts per million changes in atmospheric gas concentrations!).  While the sun still is not the only factor driving the mercilessly complex climate, clearly solar activity in red was higher in the latter half of the century when temperatures in green were rising.  Which is at least as tight as the relation between CO2 and the same warming.

Anyway, why does any of this matter?  Skeptics have argued for quite some time that climate models assume too high of a sensitivity of temperature to CO2 — in other words, while most of us agree that Co2 increases can affect temperatures somewhat, the models assume temperature to be very sensitive to CO2, in large part because the models assume that the world’s climate is dominated by positive feedback.

One way to demonstrate that these models may be exaggerated is to plot their predictions backwards.  A relationship between Co2 and temperature that exists in the future should hold in the past, adjusting for time delays  (in fact, the relationship should be more sensitive in the past, since sensitivity is a logarithmic diminishing-return curve).  But projecting the modelled sensitivities backwards (with a 15-year lag) result in ridiculously high predicted historic temperature increases that we simply have never seen.  I discuss this in some depth in my 10 minute video here, but the key chart is this one:
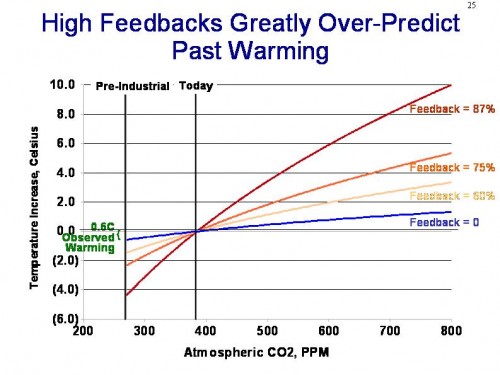
feedback_projection

You can see the video to get a full explanation, but in short, models that include high net positive climate feedbacks have to produce historical warming numbers that far exceed measured results.  Even if we assign every bit of 20th century warming to man-made causes, this still only implies 1C of warming over the next century.

So the only way to fix this is with what modelers call a plug.  Create some new variable, in this case “the hypothetical temperature changes without manmade CO2,” and plug it in.  By making this number very negative in the past, but flat to positive in the future, one can have a forecast that rises slowly in the past but rapidly in the future.

Now, I can’t prove that this is what was done.  In fact, I am perfectly willing to believe that modelers can spin a plausible story with enough jargon to put off most layman, as to how they created this “non-man” line and why it has been decreasing over the last half of the century.   I have a number of reasons to disbelieve any such posturing:

  1. The last IPCC report spent about a thousand pages on developing the the “with Co2” forecasts.  They spent about half a page discussing the “without Co2” case.  These is about zero scientific discussion of how this forecast is created, or what the key elements are that drive it
  2. The IPCC report freely admits their understanding of cooling factors is “low”
  3. The resulting forecasts is WAY to good.  We will see this again in a moment.  But with such a chaotic system, your first reaction to anyone who shows you a back-cast that nicely overlays history almost exactly should be “bullshit.”  Its not possible, except with tuning and plugs
  4. The sun was almost undeniably stronger in the second half of the 20th century than the first half.  So what is the countervailing factor that overcomes both the sun and CO2?

The IPCC does not really say what is making the blue line go down, it just goes down (because, as we can see now, it has to to make their hypothesis work).  Today, the main answer to the question of what might be offsetting warming  is “aerosols,” particularly sulfur and carbon compounds that are man-made pollutants (true pollutants) from burning fossil fuels.  The hypothesis is that these aerosols reflect sunlight back to space and cool the earth  (by the way, the blue line above in the IPCC report is explicitly only non-anthropogenic effects, so at the time it went down due to natural effects – the manmade aerosol thing is a newer straw to grasp).

But black carbon and aerosols have some properties that create some problems with this argument, once you dig into it.  First, there are situations where they are as likely to warm as to cool.  For example, one reason the Arctic has been melting faster in the summer of late is likely due to black carbon from Chinese coal plants that land on the ice and warm it faster.

The other issue with aerosols is that they disperse quickly.  Co2 mixes fairly evenly worldwide and remains in the atmosphere for years.  Many combustion aerosols only remain in the air for days, and so they tend to be concentrated regionally.   Perhaps 10-20% of the earth’s surface might at any one time have a decent concentration of man-made aerosols.  But for that to drive a, say, half degree cooling effect that offsets CO2 warming, that would mean that cooling in these aerosol-affected areas would have to be 2.5-5.0C in magnitude.  If this were the case, we would see those colored global warming maps with cooling in industrial aerosol-rich areas and warming in the rest of the world, but we just don’t see that.  In fact, the vast, vast majority of man-made aerosols can be found in the northern hemisphere, but it is the northern hemisphere that is warming much faster than the southern hemisphere.  If aerosols were really offsetting half or more of the warming, we should see the opposite, with a toasty south and a cool north.

All of this is a long, long intro to a guest post on WUWT by Bill Illis.  He digs into one of the major climate models, GISS model E, and looks at the back-casts from this model.  What he finds mirrors a lot of what we discussed above:
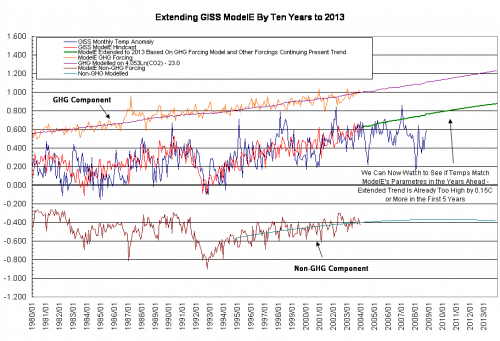
modeleextraev0

Blue is the GISS actual temperature measurement.  Red is the model’s hind-cast of temperatures.  You can see that they are remarkably, amazingly, staggeringly close.  There are chaotic systems we have been modelling for hundreds of years (e.g. the economy) where we have never approached the accuracy this relative infant of a science seems to achieve.

That red forecasts in the middle is made up of a GHG component, shown in orange, plus a negative “everything else” component, shown in brown.  Is this starting to seem familiar?  Does the brown line smell suspiciously to anyone else like a “plug?”  Here are some random thoughts inspired by this chart:

  1. As with any surface temperature measurement system, the GISS system is full of errors and biases and gaps.  Some of these their proprietors would acknowledge, and such have been pointed out by outsiders.  Never-the-less, the GISS metric is likely to have an error of at least a couple tenths of a degree.  Which means the climate model here is perfectly fitting itself to data that isn’t even likely correct.  It is fitting closer to the GISS temperature number than the GISS temperature number likely fits to the actual world temperature anomaly, if such a thing could be measured directly.  Since the Hadley Center or the satellite guys at UAH and RSS get different temperature histories for the last 30-100 years, it is interesting that the GISS model exactly matches the GISS measurement but not these others.  Does that make anyone suspicious?  When the GISS makes yet another correction of its historical data, will the model move with it?
  2. As mentioned before, the sum total of time spent over the last 10 years trying to carefully assess the forcings from other natural and man-made effects and how they vary year-to-year is minuscule compared to the time spent looking at CO2.  I don’t think we have enough knowledge to draw the Co2 line on this chart, but we CERTAINLY don’t have knowledge to draw the “all other” line (with monthly resolution, no less!).
  3. Looking back over history, it appears the model is never off by more than 0.4C in any month, and never goes more than about 10 months before re-intersecting the “actual” line.  Does it bother anyone else that this level of precision is several times higher than the model has when run forward?  Almost immediately, the model is more than 0.4C off, and goes years without intercepting reality.

Global Warming “Accelerating”

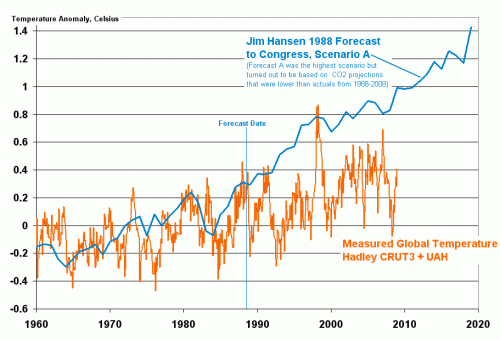
I have written a number of times about the “global warming accelerating” meme.  The evidence is nearly irrefutable that over the last 10 years, for whatever reason, the pace of global warming has decelerated (click below to enlarge)

hansenjan20091

This is simply a fact, though of course it does not necessarily “prove” that the theory of catastrophic anthropogenic global warming is incorrect.  Current results continue to be fairly consistent with my personal theory, that man-made CO2 may add 0.5-1C to global temperatures over the next century (below alarmist estimates), but that this warming may be swamped at times by natural climactic fluctuations that alarmists tend to under-estimate.

Anyway, in this context, I keep seeing stuff like this headline in the WaPo

Scientists:  Pace of Climate change Exceeds Estimates

This headline seems to clearly imply that the measured pace of actual climate change is exceeding previous predictions and forecasts.   This seems odd since we know that temperatures have flattened recently.  Well, here is the actual text:

The pace of global warming is likely to be much faster than recent predictions, because industrial greenhouse gas emissions have increased more quickly than expected and higher temperatures are triggering self-reinforcing feedback mechanisms in global ecosystems, scientists said Saturday.

“We are basically looking now at a future climate that’s beyond anything we’ve considered seriously in climate model simulations,” Christopher Field, founding director of the Carnegie Institution’s Department of Global Ecology at Stanford University, said at the annual meeting of the American Association for the Advancement of Science.

So in fact, based on the first two paragraphs, in true major media tradition, the headline is a total lie.  In fact, the correct headline is:

“Scientists Have Raised Their Forecasts for Future Warming”

Right?  I mean, this is all the story is saying, is that based on increased CO2 production, climate scientists think their forecasts of warming should be raised.  This is not surprising, because their models assume a direct positive relationship between CO2 and temperature.

The other half of the statement, that “higher temperatures are triggering self-reinforcing feedback mechanisms in global ecosystems” is a gross exaggeration of the state of scientific knowledge.  In fact, there is very little good understanding of climate feedback as a whole.  While we may understand individual pieces – ie this particular piece is a positive feedback – we have no clue as to how the whole thing adds up.  (see my video here for more discussion of feedback)

In fact, I have always argued that the climate models’ assumptions of strong positive feedback (they assume really, really high levels) is totally unrealistic for a long-term stable system.  In fact, if we are really seeing runaway feedbacks triggered after the less than one degree of warming we have had over the last century, it boggles the mind how the Earth has staggered through the last 5 billion years without a climate runaway.

All this article is saying is “we are raising our feedback assumptions higher than even the ridiculously high assumptions we were already using.”  There is absolutely no new confirmatory evidence here.

But this creates a problem for alarmists

For you see, their forecasts have consistently demonstrated themselves to be too high.  You can see above how Hansen’s forecast to Congress 20 years ago has played out (and the Hansen A case was actually based on a CO2 growth forecast that has turned out to be too low).  Lucia, who tends to be scrupulously fair about such things, shows the more recent IPCC models just dancing on the edge of being more than 2 standard deviations higher than actual measured results.

But here is the problem:  The creators of these models are now saying that actual CO2 production, which is the key input to their model, is far exceeding their predictions.  So, presumably, if they re-ran their predictions using actual CO2 data, they would get even higher temperature forecasts. Further, they are saying that the feedback multiplier in their models should be higher as well.  But the forecasts of their models are already high vs. observations — this will even cause them to diverge further from actual measurements.

So here is the real disconnect of the model:  If you tell me that modelers underestimated the key input (CO2) in their models,  and have so far overestimated the key output (Temperature), I would have said the conclusion to this article is that climate sensitivity must be lower than what was embedded in the models.  But they are saying exactly the opposite.  How is this possible?

Postscript: I hope readers understand this, but it is worth saying because clearly reporters do not understand this:  There is no way that climate change from CO2 can be accelerating if global warming is not accelerating.  There is no mechanism I have ever heard by which CO2 can change the climate without the intermediate step of raising temperatures.  Co2–>temperature increase–>changes in the climate.

Update: Chart originally said 1998 forecast.  Has been corrected to 1988.

Update#2: I am really tired of having to re-explain the choice of using Hansen’s “A” forecast, but I will do it again.  Hansen had forecasts A, B, C, with A being based on more CO2 than B, and B with more CO2 than C.  At the time, Hansen said he thought the A case was extreme.  This is then used by his apologists to say that I am somehow corrupting Hansen’s intent or taking him out of context by using the A case, because Hansen himself at the time said the A case was probably high.

But the only difference between A, B, and C were not the model assumptions of climate sensitivity or any other variable — they only differed in the amount of Co2 growth and the number of volcano eruptions (which have a cooling effect via aerosols).  We can go back and decide for ourselves which case turned out to be the most or least conservative.   As it turns out, all three cases UNDERESTIMATED the amount of CO2 man produced in the last 20 years.  So, we should not really use any of these lines as representative, but Scenario A is by far the closest.  The other two are way, way below our actual CO2 history.

The people arguing to use, say, the C scenario for comparison are being disingenuous.  The C scenario, while closer to reality in its temperature forecast, was based on an assumption of a freeze in Co2 production levels, something that obviously did not occur.

Can you have a consensus if no one agrees what the consensus is?

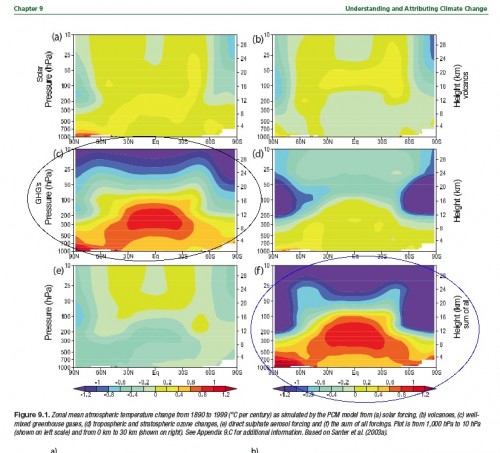
Over at the Blackboard, Lucia has a post with a growing set of comments about anthropogenic warming and the tropical, mid-tropospheric hotspot.  Unlike many who are commenting on the topic, I have actually read most of the IPCC AR4 (painful as that was), and came to the same conclusion as Lucia:  that the IPCC said the climate models predicted a hot spot in the mid-troposphere, and that this hot spot was a unique fingerprint of global warming (“fingerprint” being a particularly popular word among climate scientists).  Quoting Lucia:

I have circled the plates illustrating the results for well mixed GHG’s and those for all sources of warming combined. As you see, according to the AR4– a consensus document written for the UN’s IPCC and published in 2007 — models predict the effect of GHG’s as distinctly different from that of solar or volcanic forcings. In particular: The tropical tropospheric hotspots appears in the plate discussing heating by GHG’s and does not appear when the warming results from other causes.

hotspotar9_fordeepclimate

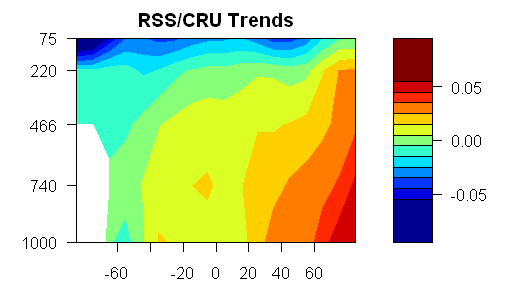
OK, pretty straight-forward.   The problem is that this hot spot has not really appeared.  In fact, the pattern of warming by altitude and latitude over the last thirty years looks nothing like the circled prediction graphs.  Steve McIntyre does some processing of RSS satellite data and produces this chart of actual temperature anomalies for the last 30 years by attitude and altitude  (Altitude is measured in these graphs by atmospheric pressure, where 1000 millibars is the surface and 100 millibars is about 10 miles up.

bigred50

The scientists at RealClimate (lead defenders of the climate orthodoxy) are not unaware that the hot spot is not appearing.  They responded about a year ago that 1)  The hot spot is not an anthropogentic-specific fingerprint at all, but will result from all new forcings

the pattern really has nothing to do with greenhouse gas changes, but is a more fundamental response to warming (however caused). Indeed, there is a clear physical reason why this is the case – the increase in water vapour as surface air temperature rises causes a change in the moist-adiabatic lapse rate (the decrease of temperature with height) such that the surface to mid-tropospheric gradient decreases with increasing temperature (i.e. it warms faster aloft). This is something seen in many observations and over many timescales, and is not something unique to climate models.

and they argued 2) that we have not had enough time for the hot spot to appear and they argued 3) all that satellite data really has a lot of error in it anyway.

Are the Real Climate guys right on this?  I don’t know.  That’s what they suck up all my tax money for, to figure this stuff out.

But here is what makes me crazy:  It is quite normal in science for scientists to have a theory, make a prediction based on this theory, and then go back and tweak the theory when data from real physical processes does not match the predictions.  There is certainly no shame in being wrong.  The whole history of science is about lurching from failed hypothesis to the next, hopefully improving understanding with each iteration.

But the weird thing about climate science is the sort of Soviet-era need to rewrite history.  Commenters on both Lucia’s site and at Climate Audit argue that the IPCC never said the hot spot was a unique fingerprint.  The fingerprint has become an un-person.

Why would folks want to do this?  After all, science is all about hypothesis – experimentation – new hypothesis.  Well, most science.  The problem is that climate science has been declared to be 1)  A Consensus and 2) Settled.    But settled consensus can’t, by definition, have disagreements and falsified forecasts.  So history has to be rewritten to protect the infallibility of the Pope the Presidium the climate consensus.  It’s a weird way to conduct science, but a logical outcome when phrases like “the science is settled” and  “consensus” are used as clubs to silence criticism.