Isn’t Gavin Schmidt Out on Strikes By Now?

From the Washington Post today"

According to the NASA analysis, the global average land-ocean temperature last year was 58.2 degrees Fahrenheit, slightly more than 1 degree above the average temperature between 1951 and 1980, which scientists use as a baseline. While a 1-degree rise may not seem like much, it represents a major shift in a world where average temperatures over broad regions rarely vary more than a couple hundredths of a degree.

This is not written as a quote from NASA’s Gavin Schmidt, but it is clear in context the statement must have come from him.  If so, the last part of the statement is absolutely demonstrably false, and for a man in Schmidt’s position is tantamount to scientific malpractice.  There are just piles of evidence from multiple disciplines – from climate and geophysics to history and literature and archeology, to say that regional climates vary a hell of a lot more than a few hundredths of a degree.  This is just absurd.

By the way, do you really want to get your science form an organation that says stuff like this:

Taking into account the new data, they said, seven of the eight warmest years on record have occurred since 2001

What new data?  That another YEAR had been discovered?  Because when I count on my own fingers, I only can come up with 6 years since 2001.

Grading the IPCC Forecasts

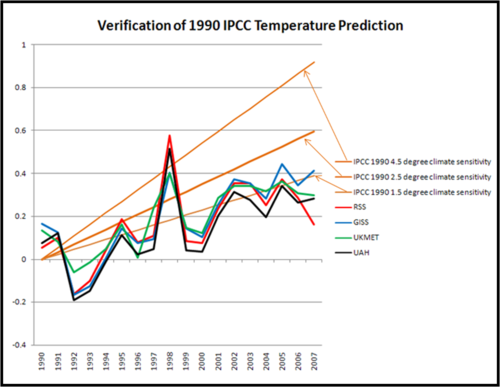
Roger Pielke Jr has gone back to the first IPCC assessment to see how the IPCC is doing on its long-range temperature forecasting.  He had to dign back into his own records, because the IPCC seems to be taking its past reports offline, perhaps in part to avoid just this kind of scrutiny.  Here is what he finds:

1990_ipcc_verification_2

The colored lines are various measures of world temperature.  Only the GISS, which maintains a surface temerpature rollup that is by far the highest of any source, manages to eek into the forecast band at the end of the period.  The two satellite measures (RSS and UAH) seldom even touch the forecast band except in the exceptional El Nino year of 1998.  Pielke comments:

On the graph you will also see the now familiar temperature records from two satellite and two surface analyses. It seems pretty clear that the IPCC in 1990 over-forecast temperature increases, and this is confirmed by the most recent IPCC report (Figure TS.26), so it is not surprising.

Which is fascinating, for this reason:  In essence, the IPCC is saying that we know that past forecasts based on a 1.5, much less a 2.5, climate sensitivity have proven to be too high, so in our most recent report we are going to base our forecast on … a 3.0+!!

The First Argument, Not the Last

The favorite argument of catastrophists in taking on skeptics is "all skeptics are funded by Exxon."  Such ad hominem rebuttals to skeptics are common, such as…

…comments like those of James Wang of Environmental Defense, who says that scientists who publish results against the consensus are “mostly in the pocket of oil companies”; and those of the, yes, United Kingdom’s Royal Society that say that there “are some individuals and organisations, some of which are funded by the US oil industry, that seek to undermine the science of climate change and the work of the IPCC”

and even from the editor of Science magazine:

As data accumulate, denialists retreat to the safety of the Wall Street Journal op-ed page or seek social relaxation with old pals from the tobacco lobby from whom they first learned to "teach the controversy."

Here is my thought on this subject.  There is nothing wrong with mentioning potential biases in your opponent as part of your argument.  For example, it is OK to argue "My opponent has X and Y biases, which should make us suspicious of his study.  Let’s remember these as we look into the details of his argument to see his errors…"  In this case, pointing to potential biases is an acceptable first argument before taking on issues with the opponent’s arguments.  Unfortunately, climate catastrophists use such charges as their last and only argument.  The believe they can stick the "QED" in right after the mention of Exxon funding, and then not bother to actually deal with the details.

Postscript:  William Briggs makes a nice point on the skeptic funding issue that I have made before:

The editors at Climate Resistance have written an interesting article about the “Well funded ‘Well-funded-Denial-Machine’ Denial Machine”, which details Greenpeace’s chagrin on finding that other organizations are lobbying as vigorously as they are, and that these counter-lobbyists actually have funding! For example, the Competitive Enterprise Institute, a think tank “advancing the principles of free enterprise and limited government”, got, Greenpeace claims, about 2 million dollars from Exxon Mobil from 1998 to 2005. The CEI has used some of this money to argue that punitive greenhouse laws aren’t needed. Greenpeace sees this oil money as ill-gotten and say that it taints all that touch it. But Greenpeace fails to point out that, over the same period, they got about 2 billion dollars! (Was any of that from Exxon, Greenpeace?)

So even though Greenpeace got 1000 times more than the CEI got, it helped CEI to effectively stop enlightenment and “was enough to stall worldwide action on climate change.” These “goats” have power!

Most skeptics are well aware that climate catastrophists themselves have strong financial incentives to continue to declare the sky is falling, but we don’t rely on this fact as 100% or even 10% of our "scientific" argument.

Thoughts on Satelite Measurement

From my comments to this post on comparing IPCC forecasts to reality, I had a couple of thoughts on satellite temperature measurement that I wanted to share:

  1. Any convergence of surface temperature measurements with satellite should be a source of skepticism, not confidence.  We know that the surface temperature measurement system is immensely flawed:  there are still many station quality issues in the US like urban biases that go uncorrected, and the rest of the world is even worse.  There are also huge coverage gaps (read:  oceans).  The fact this system correlates with satellite measurement feels like the situation where climate models, many of which take different approaches, some of them demonstrably wrong or contradictory, all correlate well with history.  It makes us suspicious the correlation is a managed artifact, not a real outcome.
  2. Satellite temperature measurement makes immensely more sense – it has full coverage (except for the poles) and is not subject to local biases.  Can anyone name one single reason why the scientific community does not use the satellite temps as the standard EXCEPT that the "answer" (ie lower temperature increases) is not the one they want?  Consider the parallel example of measurement of arctic ice area.  My sense is that before satellites, we got some measurements of arctic ice extent from fixed observation stations and ship reports, but these were spotty and unreliable.  Now satellites make this measurement consistent and complete.  Would anyone argue to ignore the satellite data for spotty surface observations?  No, but this is exactly what the entire climate community seems to do for temperature.

How Much Are Sea Levels Rising?

This is a surprisingly tricky question.  It turns out sea level is much less of a static benchmark than we might imagine.  Past efforts to measure long-term trends in sea level have been frustrating.  For example, even if sea level is not changing, land level often is, via subsidence or the reverse.  The IPCC famously drew some of its most catastrophic sea level predictions from tide gages in Hong Kong that are on land that is sinking (thus imparting an artificial sea level rise in the data).

A new study tries to sort this out:

The article is published in Geophysical Research Letters, the authors are from Tulane University and the State University of New York at Stony Brook, and the work was not funded by any horrible industry group. Kolker and Hameed begin their article stating “Determining the rate of global sea level rise (GSLR) during the past century is critical to understanding recent changes to the global climate system. However, this is complicated by non-tidal, short-term, local sea-level variability that is orders of magnitude greater than the trend.”

Once again, we face the dual problems in climate measurement of 1. Sorting through long-term cyclical changes and 2. Very low signal to noise ratio in climate change data.

The authors further note that “Estimates of recent rates of global sea level rise (GSLR) vary considerably” noting that many scientists have calculated rates of 1.5 to 2.0 mm per year over the 20th century. They also show that other very credible approaches have led to a 1.1 mm per year result, and they note that “the IPCC [2007] calls for higher rates for the period 1993–2003: 3.1 ± 0.7.”…

Kolker and Hameed gathered long-term data regarding the Icelandic Low and the Azores High to capture variation and trend in atmospheric “Centers of Action” associated with the North Atlantic Oscillation which is regarded as “One potential driver of Atlantic Ocean sea level.” As seen in Figure 1, these large-scale features of atmospheric circulation vary considerably from year-to-year and appear to change through time in terms of latitude and longitude.

Kolker and Hameed used these relationships to statistically control for variations and trends in atmospheric circulation. They find that the “residual” sea level rise (that not explained by COA variability) in the North Atlantic lies somewhere between 0.49±0.25mm/yr and 0.93±0.39mm/yr depending on the assumptions they employ, which is substantially less than the 1.40 to 2.15 mm per year rise found in the data corrected for the glacial isostatic adjustment. This “residual” sea level rise includes both local processes such as sedimentation changes, as well as larger-scale processes such as rising global temperatures.

By the way, this forecast translates to 2-6 inches per century.  This falls slightly short of the 20+ feet Al Gore promised in his movie.

All the “Catastrophe” Comes from Feedback

I had an epiphany the other day:  While skeptics and catastrophists debate the impact of CO2 on future temperatures, to a large extent we are arguing about the wrong thing.  Nearly everyone on both sides of the debate agree that, absent of feedback, the effect of a doubling of CO2 from pre-industrial concentrations (e.g. 280 ppm to 560 ppm, where we are at about 385ppm today) is to warm the Earth by about 1°C ± 0.2°C.  What we really should be arguing about is feedback.

In the IPCC Third Assessment, which is as good as any proxy for the consensus catasrophist position, it is stated:

If the amount of carbon dioxide were doubled instantaneously, with everything else remaining the same, the outgoing infrared radiation would be reduced by about 4 Wm-2. In other words, the radiative forcing corresponding to a doubling of the CO2 concentration would be 4 Wm-2. To counteract this imbalance, the temperature of the surface-troposphere system would have to increase by 1.2°C (with an accuracy of ±10%), in the absence of other changes.

Skeptics would argue that the 1.2°C is (predictably) at the high end of the band, but in the ballpark none-the-less.  The IPCC also points out that there is a diminishing return relationship between CO2 and temperature, such that each increment of CO2 has less effect on temperature than the last.  Skeptics also agree to this.  What this means in practice is that though the world, currently at 385ppm CO2, is only about 38% of the way to a doubling of CO2 from pre-industrial times, we should have seen about half of the temperature rise for a doubling, or if the IPCC is correct, about 0.6°C (again absent feedback).  This means that as CO2 concentrations rise from today’s 385 to 560 toward the end of this century, we might expect another 0.6°C warming.

This is nothing!  We probably would not have noticed the last 0.6°C if we had not been told it happened, and another 0.6°C would be trivial to manage.  So, without feedback, even by the catastrophist estimates at the IPCC, warming from CO2 over the next century will not rise about nuisance level.  Only massive amounts of positive feedback, as assumed by the IPCC, can turn this 0.6°C into a scary number.  In the IPCC’s words:

To counteract this imbalance, the temperature of the surface-troposphere system would have to increase by 1.2°C (with an accuracy of ±10%), in the absence of other changes. In reality, due to feedbacks, the response of the climate system is much more complex. It is believed that the overall effect of the feedbacks amplifies the temperature increase to 1.5 to 4.5°C. A significant part of this uncertainty range arises from our limited knowledge of clouds and their interactions with radiation. …

So, this means that debate about whether CO2 is a greenhouse gas is close to meaningless.  The real debate should be, how much feedback can we expect and in what quantities?  (By the way, have you ever heard the MSM mention the word "feedback" even once?)   And it is here that the scientific "consensus" really breaks down.  There is no good evidence that feedback numbers are as high as those plugged into climate models, or even that they are positive.  This quick analysis demonstrates pretty conclusively that net feedback is probably pretty close to zero.  I won’t go much more into feedback here, but suffice it to say that climate scientists are way out on a thin branch in assuming that a long-term stable process like climate is dominated by massive amounts of positive feedback.  I discuss and explain feedback in much more detail here and here.

Update:  Thanks to Steve McIntyre for digging the above quotes out of the Third Assessment Report.  I have read the Fourth report cover to cover and could not find a single simple statement making this breakdown of warming between CO2 in isolation and CO2 with feedbacks.  The numbers and science has not changed, but they seem to want to bury this distinction, probably because the science behind the feedback analysis is so weak.

Sea Ice Rorschach Test

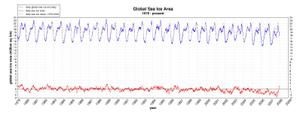
The chart below is from the Cryosphere Today and shows the sea ice anomaly for the short period of time (since 1979) we have been able to observe it by satellite.  The chart is large so you need to click the thumbnail below to really see it:

Sea_ice_jan_2008_2

OK, now looking at the anomaly in red, what do you see:

  1. A trend in sea ice consistent with a 100+ year warming trend?
  2. A sea ice extent that is remarkably stable except for an anomaly over the last three years which now appears to be returning to normal?

The media can only see #1.  I may be crazy, but it sure looks like #2 to me.

They are Not Fudge Factors, They are “Flux Adjustments”

Previously, I have argued that climate models can duplicate history only because they are fudged.  I understand this phenomenon all too well, because I have been guilty of it many times.  I have built economic and market models for consulting clients that seem to make sense, yet did not backcast history very well, at least until I had inserted a few "factors" into them.

Climate modelers have sworn for years that they are not doing this.  But Steve McIntyre finds this in the IPCC 4th Assessment:

The strong emphasis placed on the realism of the simulated base state provided a rationale for introducing ‘flux adjustments’ or ‘flux corrections’ (Manabe and Stouffer, 1988; Sausen et al., 1988) in early simulations. These were essentially empirical corrections that could not be justified on physical principles, and that consisted of arbitrary additions of surface fluxes of heat and salinity in order to prevent the drift of the simulated climate away from a realistic state.

Boy, that is some real semantic goodness there.  We are not putting in fudge factors, we are putting in "empirical corrections that could not be justified on physical principles" that were "arbitrary additions" to the numbers.  LOL.

But the IPCC only finally admits this because they claim to have corrected it, at least in some of the models:

By the time of the TAR, however, the situation had evolved, and about half the coupled GCMs assessed in the TAR did not employ flux adjustments. That report noted that ‘some non-flux adjusted models are now able to maintain stable climatologies of comparable quality to flux-adjusted models’

Let’s just walk on past the obvious question of how they define "comparable quality" or why scientists are comfortable when multiple models using different methodologies, several of which are known to be wrong, come up with nearly the same exact answer.  Let’s instead be suspicious that the problem of fudging has not gone away, but likely has just had its name changed again, as climate scientists are likely tuning the models but with tools other than changes to flux values.  But climate models have hundreds of other variables that can be fudged, and, remembering this priceless quote

"I remember my friend Johnny von Neumann used to say, ‘with four parameters I can fit an elephant and with five I can make him wiggle his trunk.’" A meeting with Enrico Fermi, Nature 427, 297; 2004.

We should be suspicious.  But we don’t just have to rely on our suspicions, because the IPCC TAR goes on to essentially confirm my fears:

(1.5.3) The design of the coupled model simulations is also strongly linked with the methods chosen for model initialisation. In flux adjusted models, the initial ocean state is necessarily the result of preliminary and typically thousand-year-long simulations to bring the ocean model into equilibrium. Non-flux-adjusted models often employ a simpler procedure based on ocean observations, such as those compiled by Levitus et al. (1994), although some spin-up phase is even then necessary. One argument brought forward is that non-adjusted models made use of ad hoc tuning of radiative parameters (i.e., an implicit flux adjustment).

Update:  In another post, McIntyre points to just one of the millions of variables in these models and shows how small changes in assumptions make huge differences in the model outcomes.  The following is taken directly from the IPCC 4th assessment:

The strong effect of cloud processes on climate model sensitivities to greenhouse gases was emphasized further through a now-classic set of General Circulation Model (GCM) experiments, carried out by Senior and Mitchell (1993). They produced global average surface temperature changes (due to doubled atmospheric CO2 concentration) ranging from 1.9°C to 5.4°C, simply by altering the way that cloud radiative properties were treated in the model. It is somewhat unsettling that the results of a complex climate model can be so drastically altered by substituting one reasonable cloud parameterization for another, thereby approximately replicating the overall intermodel range of sensitivities.

Overestimating Climate Feedback

I can never make this point too often:  When considering the scientific basis for climate action, the issue is not the warming caused directly by CO2.  Most scientists, even the catastrophists, agree that this is on the order of magnitude of 1C per doubling of CO2 from 280ppm pre-industrial to 560ppm (to be reached sometime late this century).  The catastrophe comes entirely from assumptions of positive feedback which multiplies what would be nuisance level warming to catastrophic levels.

My simple analysis shows positive feedbacks appear to be really small or non-existent, at least over the last 120 years.  Other studies show higher feedbacks, but Roy Spencer has published a new study showing that these studies are over-estimating feedback.

And the fundamental issue can be demonstrated with this simple example: When we analyze interannual variations in, say, surface temperature and clouds, and we diagnose what we believe to be a positive feedback (say, low cloud coverage decreasing with increasing surface temperature), we are implicitly assuming that the surface temperature change caused the cloud change — and not the other way around.

This issue is critical because, to the extent that non-feedback sources of cloud variability cause surface temperature change, it will always look like a positive feedback using the conventional diagnostic approach. It is even possible to diagnose a positive feedback when, in fact, a negative feedback really exists.

I hope you can see from this that the separation of cause from effect in the climate system is absolutely critical. The widespread use of seasonally-averaged or yearly-averaged quantities for climate model validation is NOT sufficient to validate model feedbacks! This is because the time averaging actually destroys most, if not all, evidence (e.g. time lags) of what caused the observed relationship in the first place. Since both feedbacks and non-feedback forcings will typically be intermingled in real climate data, it is not a trivial effort to determine the relative sizes of each.

While we used the example of random daily low cloud variations over the ocean in our simple model (which were then combined with specified negative or positive cloud feedbacks), the same issue can be raised about any kind of feedback.

Notice that the potential positive bias in model feedbacks can, in some sense, be attributed to a lack of model “complexity” compared to the real climate system. By “complexity” here I mean cloud variability which is not simply the result of a cloud feedback on surface temperature. This lack of complexity in the model then requires the model to have positive feedback built into it (explicitly or implicitly) in order for the model to agree with what looks like positive feedback in the observations.

Also note that the non-feedback cloud variability can even be caused by…(gasp)…the cloud feedback itself!

Let’s say there is a weak negative cloud feedback in nature. But superimposed upon this feedback is noise. For instance, warm SST pulses cause corresponding increases in low cloud coverage, but superimposed upon those cloud pulses are random cloud noise. That cloud noise will then cause some amount of SST variability that then looks like positive cloud feedback, even though the real cloud feedback is negative.

I don’t think I can over-emphasize the potential importance of this issue. It has been largely ignored — although Bill Rossow has been preaching on this same issue for years, but phrasing it in terms of the potential nonlinearity of, and interactions between, feedbacks. Similarly, Stephen’s 2005 J. Climate review paper on cloud feedbacks spent quite a bit of time emphasizing the problems with conventional cloud feedback diagnosis.

This is Science??

This, incredibly, comes from the editor of Science magazine

With respect to climate change, we have abruptly passed the tipping point in what until recently has been a tense political controversy. Why? Industry leaders, nongovernmental organizations, Al Gore, and public attention have all played a role. At the core, however, it’s about the relentless progress of science. As data accumulate, denialists retreat to the safety of the Wall Street Journal op-ed page or seek social relaxation with old pals from the tobacco lobby from whom they first learned to "teach the controversy." Meanwhile, political judgments are in, and the game is over. Indeed, on this page last week, a member of Parliament described how the European Union and his British colleagues are moving toward setting hard targets for greenhouse gas reductions.

Guess we can certainly expect him to be thoughtful and balanced in his evaluation of submissions for the magazine.  "seek social relaxation with old pals from the tobacco lobby"??  My god that is over the top.

Possibly the Most Important Climate Study of 2007

I have referred to it before, but since I have been posting today on surface temperature measurement, I thought I would share a bit more on "Quantifying the influence of anthropogenic surface processes and inhomogeneities on gridded global climate data" by Patrick Michaels and Ross McKitrick that was published two weeks ago in Journal of Geophysical Research – Atmospheres (via the Reference Frame).

Michaels and McKitrick found what nearly every sane observer of surface temperature measurement has known for years:  That surface temperature readings are biased by urban growth.  The temperature measurement station I documented in Tucson has been reading for 100 years or so.  A century ago, it was out alone in the desert in a one horse town.  Today, it is in the middle of an asphalt parking lot dead center of a town of over 500,000 people.

Here is what they did and found:

They start with the following thesis. If the temperature data really measure the climate and its warming and if we assume that the warming has a global character, these data as a function of the station should be uncorrelated to various socioeconomic variables such as the GDP, its growth, literacy, population growth, and the trend of coal consumption. For example, the IPCC claims that less than 10% of the warming trend over land was due to urbanization.

However, Michaels and McKitrick do something with the null hypothesis that there is no correlation – something that should normally be done with all hypotheses: to test it. The probability that this hypothesis is correct turns out to be smaller than 10-13. Virtually every socioeconomic influence seems to be correlated with the temperature trend. Once these effects are subtracted, they argue that the surface warming over land in the last 25 years or so was about 50% of the value that can be uncritically extracted from the weather stations.

Moreover, as a consistency check, after they subtract the effects now attributed to socioeconomic factors, the data from the weather stations become much more compatible with the satellite data! The first author thinks that it is the most interesting aspect of their present paper and I understand where he is coming from.

What they are referring to in this last paragraph is the fact that satellites have been showing a temperature anomaly in the troposphere about half the size of the surface temperature readings, despite the fact that the theory of global warming says pretty clearly that the troposphere should warm from CO2 more than the surface.

I will repeat what I said before:  The ONLY reason I can think of that climate scientists still eschew satellite measurement in favor of surface temperature measurement is because the surface readings are higher.  Relying on the likely more accurate satellite data would only increase the already substantial divergence problem they have between their models and reality.

Temperature Measurement Fact of the Day

Climate scientists know this of course, but there is something I learned about surface temperature measurement that really surprised me when I first got into this climate thing.  Since this is a blog mainly aimed at educating the layman, I thought some of you might find this surprising as well.

Modern temperatures sensors, like the MMTS that is used at many official USHCN climate stations, can theoretically read temperatures every hour or minute or even continuously.  I originally presumed that these modern devices arrived at a daily temperature reading by continuously integrating the temperature over a 24-hour day, or at worst averaging 24 hourly readings.

WRONG!  While in fact many of the instruments could do this, in reality they do not.  The official daily temperature in the USHCN and most other databases is based on the average of that day’s high and low temperatures.  "Hey, that’s crazy!" You say.  "What if the temperature hovered at 50 degrees for 23 hours, and then a cold front comes in the last hour and drops the temperature 10 degrees.  Won’t that show the average for the day around 45 when in fact the real average is 49.8 or so?"  Yes.  All true.  The method is course and it sucks. 

Surface temperature measurements are often corrected if the time of day that a "day" begins and ends changes.  Apparently, a shift form a midnight to say a 3PM day break can make a several tenths of degree difference in the daily averages.  This made no sense to me.  How could this possibly be true?  Why should an arbitrary begin or end of a day make a difference, assuming that one is looking at a sufficiently long number of days.  That is how I found out that the sensors were not integrating over the day but just averaging highs and lows.  The latter methodology CAN be biased by the time selected for a day to begin and end (though I had to play around with a spreadsheet for a while to prove it to myself).  Stupid. Stupid. Stupid.

It is just another reason why the surface temperature measurement system is crap, and we should be depending on satellites instead.  Can anyone come up with one single answer as to why climate scientists eschew satellite measurements for surface temperatures EXCEPT that the satellites don’t give the dramatic answer they want to hear?  Does anyone for one second imagine that any climate scientist would spend 5 seconds defending the surface temperature measurement system over satellites if satellites gave higher temperature readings?

Postscript:  Roger Pielke has an interesting take on how this high-low average method introduces an upwards bias in surface temperatures.

Cargo Cult Science

A definition of "cargo cult" science, actually in the context of particle and high-energy physics, but the term will feel very familiar to those of us who try to decipher climate science:

Her talk is a typical example of cargo cult science. They use words that sound scientific, they talk about experiments and about their excitement. Formally, everything looks like science. There is only one problem with their theoretical work: the airplanes don’t land and the gravitons don’t scatter. It is because they are unable to impartially evaluate facts, to distinguish facts from wishful thinking and results from assumptions, and to abandon hypotheses that have been falsified.

They play an "everything goes" game instead. In this game, nothing is ever abandoned because it would apparently be too cruel for them. They always treat "Yes" and "No" as equal, never answer any question, except for questions where their answers seem to be in consensus – and these answers are usually wrong.

The Technocratic Trap

Technocrats tend to hate and/or distrust bottom up economic solutions that result from a spontaneous order resulting from changing pricing signals and incentives.  As a result, technocrats in government tend to not only want a problem solved, but solved their way.  They get just as mad, or even more upset, at a problem solved by the market in a way in which the don’t approve than they get from the problem going unsolved altogether.

TJIC brings us a great example of this technocratic trap as applied to CO2 abatement:

http://www.boston.com/news/local/article…

Greenhouse gas emissions from Northeast power plants were about 10 percent lower than predicted during the last two years…

But the decrease may have some unanticipated consequences for efforts to combat global warming: It could have the perverse effect of delaying more lasting reductions, by undercutting incentives intended to spur power plants to invest in cleaner technologies and energy efficiency…

I wonder if environmentalists are really as pathetic and perpetually grumpy as they always sound, or if that’s just some sort of kabuki political theater?

Massachusetts and nine other Northeast states are part of a landmark pact called the Regional Greenhouse Gas Initiative that is designed to cap power plant emissions in 2009 and then gradually reduce them by 10 percent over the next decade. Power plants will have to buy emission allowances…

But if emissions are significantly lower than the cap, there would be less demand for allowances, driving down their price and giving power plants little financial incentive to invest in cleaner and more efficient technologies…

It’s almost as if people are hung up on the means, and not the ends.

Oh noz, the industry has realized that the cheapest way (which is to say “the way that bes preserves living standards) to cut carbon emissions is to switch from coal to natural gas…which means that they’re not taking the more expensive way (which is to say “way that destroys living standards”) that we want them to. Boo hoo!

“If the cap is above what power plants are emitting, we won’t see any change in their behavior,” said Derek K. Murrow, director of policy analysis for Environment Northeast, a nonprofit research and advocacy organization. “They just continue business as usual.”

(a) Umm…you’ve already seen a change in their behavior

(b) what do you want? Lower carbon emissions, or to force them to use some pet technology?…

Officials of states involved in RGGI and energy specialists are discussing ways to ensure that allowances have enough value to spark investments in cleaner technologies.

Again, the insistence on technologies. Why?

One solution would be to lower the cap, but that’s likely to be politically difficult…

Laurie Burt, commissioner of the Massachusetts Department of Environmental Protection, said she and other state officials are aware of the problem and discussing ways to solve it.

What problem?

Read it all.

Update: False Sense of Security

A while back I wrote about a number of climate forecasts (e.g. for 2007 hurricane activity) wherein we actually came in in the bottom 1% of forecasted outcomes.  I wrote:

If all your forecasts are coming out in the bottom 1% of the forecast range, then it is safe to assume that one is not forecasting very well.

Well, now that the year is over, I can update one of those forecasts, specifically the forecasts from the UK government Met office that said:

  • Global temperature for 2007 is expected to be 0.54 °C above the long-term (1961-1990) average of 14.0 °C;
  • There is a 60% probability that 2007 will be as warm or warmer than the current warmest year (1998 was +0.52 °C above the long-term 1961-1990 average).

Playing around with the numbers, and assuming a normal distribution of possible outcomes, this implies that their forecast mean is .54C and their expected std deviation is .0785C.  This would give a 60% probability of temperatures over 0.52C.

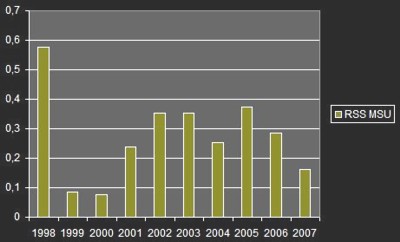
The most accurate way to measure the planet’s temperature is by satellite.  This is because satellite measurements include the whole globe (oceans, etc) and not just a few land areas where we have measurement points.  Satellites are also free of things like urban heat biases.  The only reason catastrophists don’t agree with this statement is because satellites don’t give them the highest possible catastrophic temperature reading (because surface readings are, in fact, biased up).  Using this satellite data:

Rssmsuanomaly

and scaling the data to a .52C anomaly in 1998 gets a reading for 2007 of 0.15C.  For those who are not used to the magnitude of anomalies, 0.15C is WAY OFF from the forecasted 0.54C.  In fact, using the mean and std. deviation of the forecast we derived above, the UK Met office basically was saying that it was 99.99997% certain that the temperature would not go so low.  Another way of saying this is that the Met office forecast implied 2,958,859:1 odds against the temperature being this low in 2007.

What are the odds that the Met office needs to rethink its certainty level?

Much more from The Reference Frame

Burying Trees

[Cross-posted from Coyote Blog]

A few weeks ago I argued that if we really thought that CO2 was the biggest threat to the environment (a proposition with which I do not agree) we should not recycle paper or Christmas trees – we should wrap them in Saran Wrap and bury them.  Earlier I wrote this:

Once trees hit their maturity, their growth slows and therefore the rate they sequester CO2 slows.  At this point, we need to be cutting more down, not less, and burying them in the ground, either as logs or paper or whatever.  Just growing forests is not enough, because old trees fall over and rot and give up their carbon as CO2.  We have to bury them.   Right?

I was being a bit tongue-in-cheek, trying to take CO2 abatement to its illogical extreme, but unfortunately the nuttiness of the environmental movement can outrun satire.  These folks advocate going into the forests and cutting down trees and burying them:

Here a carbon sequestration strategy is proposed in which certain dead or live trees are harvested via collection or selective cutting, then buried in trenches or stowed away in above-ground shelters. The largely anaerobic condition under a sufficiently thick layer of soil will prevent the decomposition of the buried wood. Because a large flux of CO2 is constantly being assimilated into the world as forests via photosynthesis, cutting off its return pathway to the atmosphere forms an effective carbon sink….

Based on data from North American logging industry, the cost for wood burial is estimated to be $14/tCO2 ($50/tC), lower than the typical cost for power plant CO2 capture with geological storage. The cost for carbon sequestration with wood burial is low because CO2 is removed from the atmosphere by the natural process of photosynthesis at little cost. The technique is low tech, distributed, easy to monitor, safe, and reversible, thus an attractive option for large-scale implementation in a world-wide carbon market

Its a little scary to me that I can anticipate this stuff.

More on Feedback

James Annan, more or less a supporter of catastrophic man-made global warming theory, explains how typical climate sensitivities (of the order of magnitude of 3 or more) used by catastrophists are derived (in an email to Steve McIntyre)  As a reminder, climate sensitivity is the amount of temperature rise we would expect on earth from a doubling of CO2 from pre-industrial 280ppm to 560ppm.

If you want to look at things in the framework of feedback analysis, there’s a pretty clear explanation in the supplementary information to Roe and Baker’s recent Science paper. Briefly, if we have a blackbody sensitivity S0 (~1C) when everything else apart from CO2 is held fixed, then we can write the true sensitivity S as

S = S0/(1- Sum (f_i))

where the f_i are the individual feedback factors arising from the other processes. If f_1 for water vapour is 0.5, then it only takes a further factor of 0.17 for clouds (f_2, say) to reach the canonical S=3C value. Of course to some extent this may look like an artefact of the way the equation is written, but it’s also a rather natural way for scientists to think about things and explains how even a modest uncertainty in individual feedbacks can cause a large uncertainty in the overall climate sensitivity.

This is the same classic feedback formula I discussed in this prior article on feedback.  And Dr. Annan basically explains the origins of the 3C sensitivity the same way I have explained it to readers in the past:  Sensitivity from CO2 alone is about 1C (that is S0) and feedback effects from things like water vapour and clouds triples this to three.  The assumption is that the climate has very strong positive feedback.

Note the implications.  Without any feedback, or feedback that was negative, we would not expect the world to heat up much more than a degree with a doubling of CO2, of which we have already seen perhaps half.  This means we would only experience another half degree of warming in the next century or so.  But with feedbacks, this half degree of future warming is increased to 2.5 or 3.0 or more degrees.  Essentially assumptions about feedback are what separates trivial nuisance levels of warming from forecasts that are catastrophic. 

Given this, it is instructive to see what Mr. Annan has to say in the same email about our knowledge of these feedbacks:

The real wild card is in the behaviour of clouds, which have a number of strong effects (both on albedo and LW trapping) and could in theory cause a large further amplification or suppression of AGW-induced warming. High thin clouds trap a lot of LW (especially at night when their albedo has no effect) and low clouds increase albedo. We really don’t know from first principles which effect is likely to dominate, we do know from first principles that these effects could be large, given our current state of knowledge. GCMs don’t do clouds very well but they do mostly (all?) suggest some further amplification from these effects. That’s really all that can be done from first principles.

In other words, scientists don’t even know the SIGN of the most important feedback, ie clouds.  Of course, in a rush to build the most alarming model, they all seem to rush to the assumption that it is positive.  So, yes, if the feedback is a really high positive number (something that is very unlikely in natural, long-term stable physical processes) then we get a climate catastrophe.  Of course if it is small or negative, we don’t get one at all. 

My Annan points to studies he claims shows climate sensitivity net of feedbacks in the past to be in the 2-3C range.  Note that these are studies of climate changes tens or hundreds of thousands of years ago, as recorded imperfectly in ice and other proxies.  The best data we have is of course for the last 120 years when we have measured temperature with thermometers rather than ice crystals, and the evidence of this data points to a sensitivity of at most about 1C net of feedbacks.

So to summarize:

  • Climate sensitivity is the temperature increase we might expect with a doubling of CO2 to 560 ppm from a pre-industrial 280ppm
  • Nearly every forecast you have ever seen assumes the effect of CO2 alone is about a 1C warming from this doubling.  Clearly, though, you have seen higher forecasts.  All of the "extra" warming in these forecasts come from positive feedback.  So a sensitivity of 3C would be made up of 1C from CO2 directly that is tripled by positive feedbacks.  A sensitivity of 6 or 8 still starts with the same 1C but has even higher feedbacks
  • Most thoughtful climate scientists will admit that we don’t know what these feedbacks are — in so many words, modelers are essentially guessing.  Climate scientists don’t even know the sign (positive or negative) much less the magnitude.  In most physical sciences, upon meeting such an unknown system that has been long-term stable, scientists will assume neutral to negative feedback.  Climate scientists are the exception — almost all their models assume strong positive feedback.
  • Climate scientists point to studies of ice cores and such that serve as proxies for climate hundreds of thousands of years ago to justify positive feedbacks.  But for the period of history we have the best data, ie the last 120 years, actual CO2 and measured temperature changes imply a sensitivity net of feedbacks closer to 1C, about what a reasonable person would assume from a stable process not dominated by positive feedbacks.

This is Science?

It is just amazing to me that the press has granted statements like the one below the imprimatur of being scientific while labeling folks like me "anti-science" for calling them out:

Previously it was assumed that gradual increases in carbon dioxide (CO2) and other heat-trapping gases in the atmosphere would produce gradual increases in global temperatures. But now scientists predict that an increase of as little as 2˚C above pre-industrial levels could trigger environmental effects that would make further warming—as much as 8˚C—inevitable.

Worse still, a 2˚C increase is highly likely if greenhouse gas concentrations reach 450 parts per million (ppm). They presently stand at 430ppm and are increasing by 2-2.5 ppm per year.

Gee, where do I start?  Well, first, the author can’t even get the simplest facts correct.  World CO2 concentrations hover in the 380’s (the amount varies seasonally) and is not anywhere near 430.  Second, I have demonstrated any number of times that our history over the past 120 years would lead us to expect at most a 1 degree rise over pre-industrial levels at 560, and thus a 2 degree rise by 450 is not "highly likely."  Third, just look at the author’s numbers at face value.  Catastrophists believe temperatures have risen (reason disputed) about 0.6-0.7 degrees in the last century or so.  If we are really at 430 ppm, then that means the first 150ppm rise (preindustrial CO2 was bout 280ppm) caused at most 0.6C, but the next 20 ppm to 450 would cause 1.4C, this despite the fact that CO2 concentations have a diminishing return relationship to temperature.  Yeah, I understand time delays and masking, but really — whoever wrote these paragraphs can’t possibly have understood what he was writing.

But I have not even gotten to the real whopper — that somehow, once we hit 2 degrees of warming, the whole climate system will run away and temperatures will "inveitably" rise another 8C. Any person who tells you this, including Al Gore and his "tipping points," is either an idiot or a liar.  Long-term stable systems do not demonstrate this kind of radically positive feedback-driven runaway behavior (much longer post on climate and positive feedbacks here).  Such behavior is so rare in physical systems anyway, much less ones that are demonstrably long-term stable, that a scientist who assumes it without evidence has to have another agenda, because it is not a defensible assumption (and scientists have no good evidence as to the magnitude, or even the sign, of feedbacks in the climate system).

By the way, note the source and remember my and others’ warmings.  A hard core of global warming catastrophists are socialists who support global warming abatement not because they understand or agree with the science, but because they like the cover the issue gives them to pursue their historic goals.

HT:  Tom Nelson