I am always amazed at how people like to draw conclusions about what I write merely from the title, without actually reading everything I wrote. This is cross-posted from Coyote Blog, where I already am getting accusations of selling out. Please read before judging. I have proposed a carbon tax in a way that would be a net economic benefit even if one totally dismisses the threat of man-made global warming.
While I am not deeply worried about man-made climate change, I am appalled at all the absolutely stupid, counter-productive things the government has implemented in the name of climate change, all of which have costly distorting effects on the economy while doing extremely little to affect man-made greenhouse gas production. For example:
- Corn ethanol mandates and subsidies, which study after study have shown to have zero net effect on CO2 emissions, and which likely still exist only because the first Presidential primary is in Iowa. Even Koch Industries, who is one of the largest beneficiaries of this corporate welfare, has called for their abolition
- Electric car subsidies, 90% of which go to the wealthy to help subsidize their virtue signalling, and which require morefossil fuels to power than an unsubsidized Prius or even than a SUV.
- Wind subsidies, which are promoting the stupidist form for power ever, whose unpredictabilty means fossil fuel plants still have to be kept running on hot backup and whose blades are the single largest threat to endangered bird species.
- Bad government technology bets like the massive public subsidies of failed Solyndra
Even when government programs do likely have an impact of CO2, they are seldom managed intelligently. For example, the government subsidizes solar panel installations, presumably to reduce their cost to consumers, but then imposes duties on imported panels to raise their price (indicating that the program has become more of a crony subsidy for US solar panel makers, which is typical of these types of government interventions). Obama’s coal power plan, also known as his war on coal, will certainly reduce some CO2 from electricity generation but at a very high cost to consumers and industries. Steps like this are taken without any idea of whether this is the lowest cost approach to reducing CO2 production — likely it is not given the arbitrary aspects of the program.
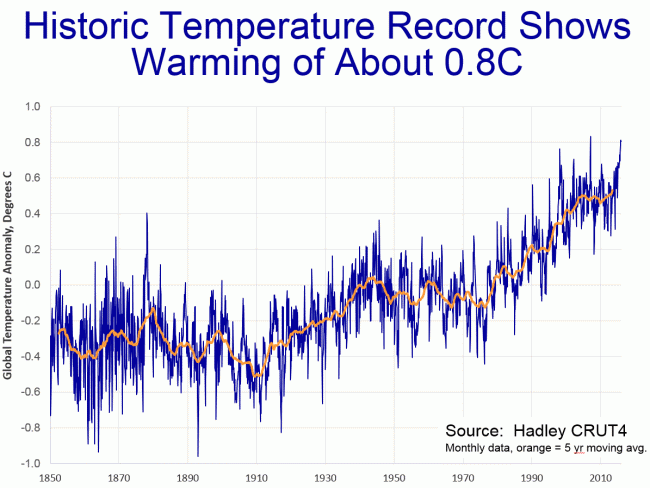
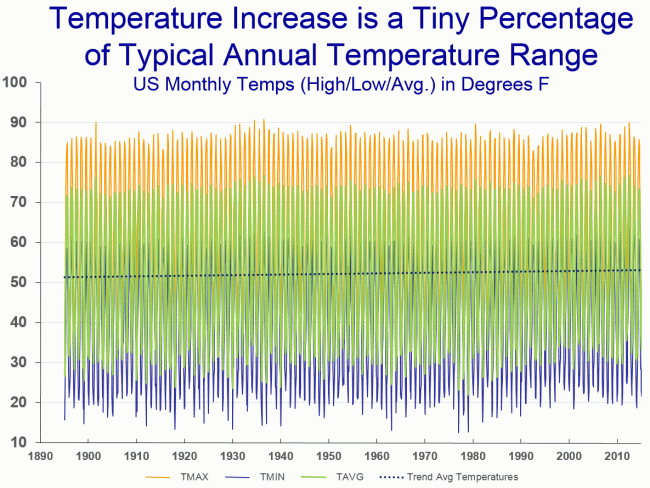
For years I have opposed steps like a Federal carbon tax or cap and trade system because I believe (and still believe) them to be unnecessary given the modest amount of man-made warming I expect over the next century. I would expect to see about one degree C of man-made warming between now and 2100, and believe most of the cries that “we are already seeing catastrophic climate changes” are in fact panics driven by normal natural variation (most supposed trends, say in hurricanes or tornadoes or heat waves, can’t actually be found when one looks at the official data).
But I am exhausted with all the stupid, costly, crony legislation that passes in the name of climate change action. I am convinced there is a better approach that will have more impact on man-made CO2 and simultaneously will benefit the economy vs. our current starting point. So here goes:
The Plan
Point 1: Impose a Federal carbon tax on fuel.
I am open to a range of actual tax amounts, as long as point 2 below is also part of the plan. Something that prices CO2 between $25 and $45 a ton seems to match the mainstream estimates out there of the social costs of CO2. I think methane is a rounding error, but one could make an adjustment to the natural gas tax numbers to take into account methane leakage in the production chain. I am even open to make the tax=0 on biofuels given these fuels are recycling carbon from the atmosphere.
A Pigovian tax on carbon in fuels is going to be the most efficient possible way to reduce CO2 production. What is the best way to reduce CO2 — by substituting gas for coal? by more conservation? by solar, or wind? with biofuels? With a carbon tax, we don’t have to figure it out. Different approaches will be tested in the marketplace. Cap and trade could theoretically do the same thing, but while this worked well in some niche markets (like SO2 emissions), it has not worked at all in European markets for CO2. There has just been too many opportunities for cronyism, too much weird accounting for things like offsets that is hard to do well, and too much temptation to pick winners and losers.
Point 2: Offset 100% of carbon tax proceeds against the payroll tax
Yes, there are likely many politicians, given their incentives, that would love a big new pool of money they could use to send largess, from more health care spending to more aircraft carriers, to their favored constituent groups. But we simply are not going to get Conservatives (and libertarians) on board for a net tax increase, particularly one to address an issue they may not agree is an issue at all. So our plan will use carbon tax revenues to reduce other Federal taxes.
I think the best choice would be to reduce the payroll tax. Why? First, the carbon tax will necessarily be regressive (as are most consumption taxes) and the most regressive other major Federal tax we have are payroll taxes. Offsetting income taxes would likely be a non-starter on the Left, as no matter how one structures the tax reduction the rich would get most of it since they pay most of the income taxes.
There is another benefit of reducing the payroll tax — it would mean that we are replacing a consumption tax on labor with a consumption tax on fuel. It is always dangerous to make gut-feel assessments of complex systems like the economy, but my sense is that this swap might even have net benefits for the economy — ie we might want to do it even if there was no such thing as greenhouse gas warming. In theory, labor and fuel are economically equivalent in that they are both production raw materials. But in practice, they are treated entirely differently by the public. Few people care about the full productive employment of our underground fuel reserves, but nearly everybody cares about the full productive employment of our labor force. After all, for most people, the primary single metric of economic health is the unemployment rate. So replacing a disincentive to hire with a disincentive to use fuel could well be popular.
Point 3: Eliminate all the stupid stuff
Oddly enough, this might be the hardest part politically because every subsidy, no matter how idiotic, has a hard core of beneficiaries who will defend it to the death — this the the concentrated benefits, dispersed cost phenomena that makes it hard to change many government programs. But never-the-less I propose that we eliminate all the current Federal subsidies, mandates, and prohibitions that have been justified by climate change. Ethanol rules and mandates, solar subsidies, wind subsidies, EV subsidies, targeted technology investments, coal plant bans, pipeline bans, drilling bans — it all should go. The carbon tax does the work.
States can continue to do whatever they want — we don’t need the Feds to step on states any more than they do already, and I continue to like the 50 state laboratory concept. If California wants to continue to subsidize wind generators, let them do it. That is between the state and its taxpayers (and for those who think the California legislature is crazy, that is what U-Haul is for).
Point 4: Revamp our nuclear regulatory regime
As much as alternative energy enthusiasts would like to deny it, the world needs reliable, 24-hour baseload power — and wind and solar are not going to do it (without a change in storage technology of at least 2 orders of magnitude in cost). The only carbon-free baseload power technology that is currently viable is nuclear.
I will observe that nuclear power suffers under some of the same problems as commercial space flight — the government helped force the technology faster than it might have grown organically on its own, which paradoxically has slowed its long-term development. Early nuclear power probably was not ready for prime time, and the hangover from problems and perceptions of this era have made it hard to proceed even when better technologies have existed. But we are at least 2 generations of technology past what is in most US nuclear plants. Small air-cooled thorium reactors and other technologies exist that could provide reliable safe power for over 100 years. I am not an expert on nuclear regulation, but it strikes me that a regime similar to aircraft safety, where a few designs are approved and used over and over makes sense. France, which has the strongest nuclear base in the world, followed this strategy. Using thorium could also have the advantage of making the technology more exportable, since its utility in weapons production would be limited.
Point 5: Help clean up Chinese, and Asian, coal production
One of the hard parts about fighting CO2 emissions, vs. all the other emissions we have tackled in the past (NOx, SOx, soot/particulates, unburned hydrocarbons, etc), is that we simply don’t know how to combust fossil fuels without creating CO2 — CO2 is inherent to the base chemical reaction of the combustion. But we do know how to burn coal without tons of particulates and smog and acid rain — and we know how to do it economically enough to support a growing, prosperous modern economy.
In my mind it is utterly pointless to ask China to limit their CO2 growth. China has seen the miracle over the last 30 years of having almost a billion people exit poverty. This is an event unprecedented in human history, and they have achieved it in part by burning every molecule of fossil fuels they can get their hands on, and they are unlikely to accept limitations on fossil fuel consumption that will derail this economic progress. But I think it is reasonable to help China stop making their air unbreathable, a goal that is entirely compatible with continued economic growth. In 20 years, when we have figured out and started to build some modern nuclear designs, I am sure the Chinese will be happy to copy these and start working on their CO2 output, but for now their Maslov hierarchy of needs should point more towards breathable air.
As a bonus, this would pay one immediate climate change benefit that likely would dwarf the near-term effect of CO2 reduction. Right now, much of this soot from Asian coal plants lands on the ice in the Arctic and Greenland. This black carbon changes the albedo of the ice, causing it to reflect less sunlight and absorb more heat. The net effect is more melting ice and higher Arctic temperatures. A lot of folks, including myself, think that the recent melting of Arctic sea ice and rising Arctic temperatures is more attributable to Asian black carbon pollution than to CO2 and greenhouse gas warming (particularly since similar warming and sea ice melting is not seen in the Antarctic, where there is not a problem with soot pollution).
Final Thoughts
At its core, this is a very low cost, even negative cost, climate insurance policy. The carbon tax combined with a market economy does the work of identifying the most efficient ways to reduce CO2 production. The economy benefits from the removal of a myriad of distortions and crony give-aways, while also potentially benefiting from the replacement of a consumption tax on labor with a consumption tax on fuel. The near-term effect on CO2 is small (since the US is only a small part of the global emissions picture), but actually larger than the near-term effect of all the haphazard current programs, and almost certainly cheaper to obtain. As an added benefit, if you can help China with its soot problem, we could see immediate improvements in probably the most visible front of man-made climate change: in the Arctic.
Postscript
Perhaps the hardest thing to overcome in reaching a compromise here is the tribalism of modern politics. I believe this is a perfectly sensible plan that even those folks who believe man-made global warming is a total myth ( a group to which I do not belong) could sign up for. The barrier, though, is tribal. I consider myself to be pretty free of team politics but my first reaction when thinking about this kind of plan was, “What? We can’t let those guys win. They are totally full of sh*t. They are threatening to throw me in jail for my opinions.”
It was at this point I was reminded of a customer service story at my company. I had a customer who was upset call me, and I ended up giving them a full-refund and a certificate to come back and visit us in the future. I actually suspected there was more to the story, but I didn’t want a bad review. The customer was happy, but my local manager was not. She called me and said, “That was a bad customer! He was lying to you. How can you let him win like that?” Does this sound familiar? I think we fall into this trap all the time in modern politics, worried more about preventing the other team from winning than about doing the right thing.


