
I titled my very first climate video “What is Normal,” alluding to the fact that climate doomsayers argue that we have shifted aspects of the climate (temperature, hurricanes, etc.) from “normal” without us even having enough historical perspective to say what “normal” is.
A more sophisticated way to restate this same point would be to say that natural phenomenon tend to show various periodicities, and without observing nature through the whole of these cycles, it is easy to mistake short term cyclical variations for long-term trends.
A paper in the journal Water Resources Research makes just this point using over 200 years of precipitation data:
We analyze long-term fluctuations of rainfall extremes in 268 years of daily observations (Padova, Italy, 1725-2006), to our knowledge the longest existing instrumental time series of its kind. We identify multidecadal oscillations in extremes estimated by fitting the GEV distribution, with approximate periodicities of about 17-21 years, 30-38 years, 49-68 years, 85-94 years, and 145-172 years. The amplitudes of these oscillations far exceed the changes associated with the observed trend in intensity. This finding implies that, even if climatic trends are absent or negligible, rainfall and its extremes exhibit an apparent non-stationarity if analyzed over time intervals shorter than the longest periodicity in the data (about 170 years for the case analyzed here). These results suggest that, because long-term periodicities may likely be present elsewhere, in the absence of observational time series with length comparable to such periodicities (possibly exceeding one century), past observations cannot be considered to be representative of future extremes. We also find that observed fluctuations in extreme events in Padova are linked to the North Atlantic Oscillation: increases in the NAO Index are on average associated with an intensification of daily extreme rainfall events. This link with the NAO global pattern is highly suggestive of implications of general relevance: long-term fluctuations in rainfall extremes connected with large-scale oscillating atmospheric patterns are likely to be widely present, and undermine the very basic idea of using a single stationary distribution to infer future extremes from past observations.
Trying to work with data series that are too short is simply a fact of life — everyone in climate would love a 1000-year detailed data set, but we don’t have it. We use what we have, but it is important to understand the limitations. There is less excuse for the media that likes to use single data points, e.g. one storm, to “prove” long term climate trends.
A good example of why this is relevant is the global temperature trend. This chart is a year or so old and has not been updated in that time, but it shows the global temperature trend using the most popular surface temperature data set. The global warming movement really got fired up around 1998, at the end of the twenty year temperature trend circled in red.
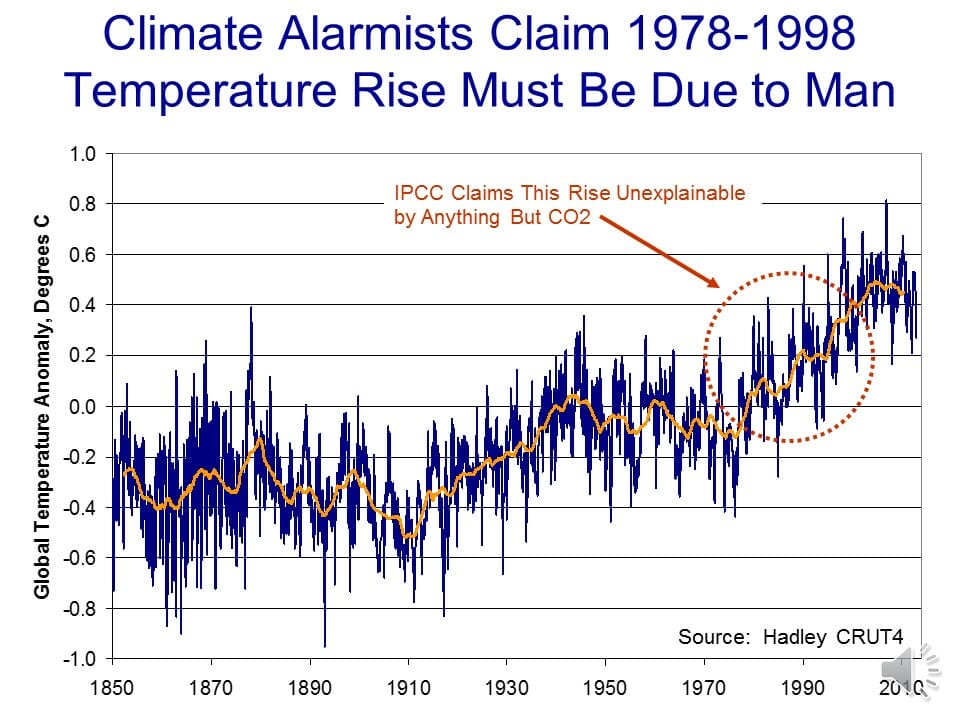
They then took the trends from these 20 years and extrapolated them into the future:
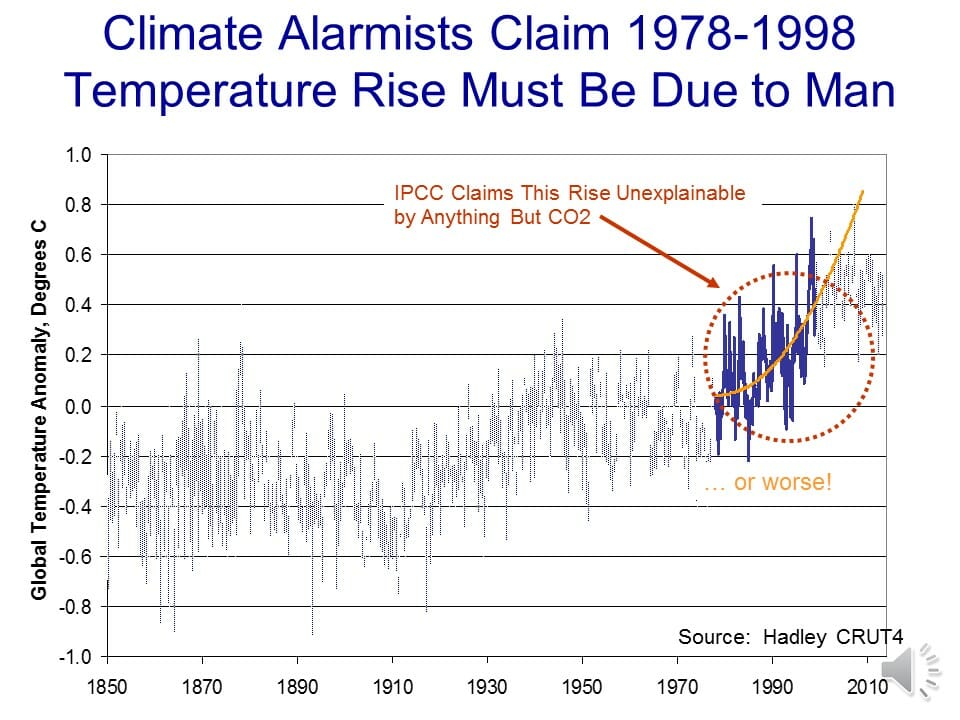
But what if that 20 years was merely the upward leg of a 40-60 year cyclic variation? Ignoring the cyclic functions would cause one to overestimate the long term trend. This is exactly what climate models do, ignoring important cyclic functions like the AMO and PDO.
In fact, you can get a very good fit with actual temperature by modeling them as three functions: A 63-year sine wave, a 0.4C per century long-term linear trend (e.g. recovery from the little ice age) and a new trend starting in 1945 of an additional 0.35C, possibly from manmade CO2.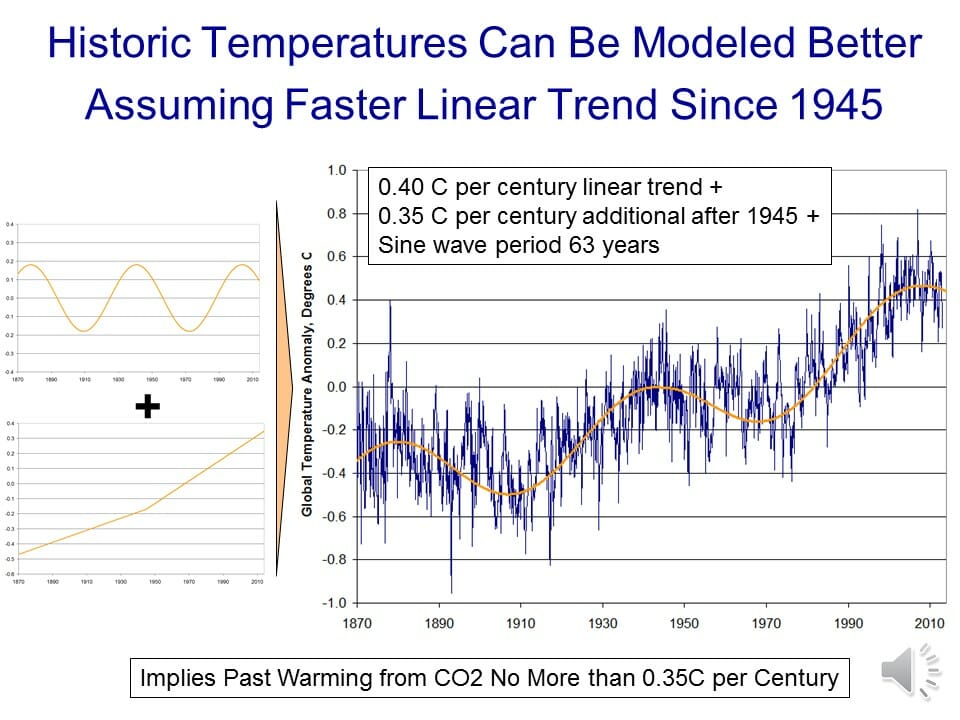
In this case, a long-term trend still appears to exist but it is exaggerated by only trying to measure it in the upward part of the cycle (e.g. from 1978-1998).
The climate models are built without regard to the natural 60 and more importantly 1000 year periodicities so obvious in the temperature record. The modelers approach is simply a scientific disaster and lacks even average commonsense .It is exactly like taking the temperature trend from say Feb – July and projecting it ahead linearly for 20 years or so. They back tune their models for less than 100 years when the relevant time scale is millennial. The whole exercise is a joke.
The entire UNFCCC -IPCC circus is a total farce- based, as it is, on the CAGW scenarios of the IPCC models which do not have even heuristic value. The earth is entering a cooling trend which will possibly last for 600 years or so.
For estimates of the timing and extent of the coming cooling based on the natural 60 and 1000 year periodicities in the temperature data and using the 10Be and neutron monitor data as the most useful proxy for solar “activity” check the series of posts at
http://climatesense-norpag.blogspot.com
The post at
http://climatesense-norpag.blogspot.com/2014/07/climate-forecasting-methods-and-cooling.html
is a good place to start. One of the first things impressed upon me in tutorials as an undergraduate in Geology at Oxford was the importance of considering multiple working hypotheses when dealing with scientific problems. With regard to climate this would be a proper use of the precautionary principle .-
The worst scientific error of the alarmist climate establishment is their unshakeable faith in their meaningless model outputs and their refusal to estimate the possible impacts of a cooling rather than a warming world and then consider what strategies might best be used in adapting to the eventuality that cooling actually develops.
May I suggest that 2015 will be the year when astute climate researchers come to the realisation that surface temperatures are controlled by thermodynamic processes (sensible convective heat transfers) as distinct from radiative heat transfer. This is the 21st century new paradigm shift I first wrote about late in 2012. Momentum is gathering as other climate blogs like The Hockey Schtick, Clive Best and Tallbloke get onto the effect of gravity, even though they have not correctly explained the energy transfer mechanisms which can be explained by the Second Law of Thermodynamics. You only have to wonder a little about how the Venus surface warms when the Sun shines to start to realise that it’s not all about radiation absorbed by the surface.
Have a happy and relaxed New Year, everyone, comforted by the now proven fact that carbon dioxide does not warm at all because valid physics shows that all it can do is cool by a minuscule amount.
The natural cycles are well correlated with the 934-year and superimposed 60 year cycles in the inverted plot of the scalar sum of the angular momentum of the Sun and all the planets seen here.
Your link doesn’t seem to work .I would like to see that data– suggestions?
Can You provide us witha the relevant R^2 and other statistical errors data corresponding to the linear regression?
Hi,
Just a couple of questions for you:
1) How do you know that the cycle is actually 40-60 years in length?
2) What does the variable C represent in your last graph?
I think that you make a good point, but there are definitely many flaws to this idea. It’s almost impossible to make an accurate statement on climate change based on 100 years of data. We must look at the whole picture, not simply a small snapshot of it, to identify an overall trend.
Shawn
I agree with you that it is difficult to assess climate trends based on such short-term data. This is a problem with both this claim and the arguments from the IPCC. I am very curious to learn more about the mechanism behind this 60-year cycle – I have read about how shifts in the center of gravity of the solar system can affect solar activity, but these shifts don’t seem drastic enough to cause climate change.
Would you have time to make your climate skeptic presentation at the Claremont colleges if you were invited? My daughter would love to see you speak there.
seeing as how Claremont treated George Will last year, one could doubt seriously any invitation would be forthcoming as this content is much too controversial and immediately sets off many trigger-warnings in California
There is much discussion of temperature trends above. I suggest all take a look at the graphic here in order to note the compelling correlation between natural climate cycles and the 934-year and superimposed 60-year cycles in the scalar sum of the angular momentum of the Sun and all the planets. This is no joke. You can also read there why carbon dioxide has nothing to do with climate, and fortunately water vapor lowers surface temperatures from what would be about 10 degrees hotter if the atmosphere was dry and devoid of clouds.
Shawn — just to clarify from the way I read this graph:
1) He does not know that the cycle is actually 40-60 years (63 years is what he used); he is saying that such a cycle fits the data better than the models provided by the IPCC.
2) The “C” in the graph represents temperature in degrees centigrade.