
Reprinted from Coyoteblog
science a “myth”. As is usual for global warming supporters, he wraps himself in the mantle of science while implying that those who don’t toe the line on the declared consensus are somehow anti-science.
Readers will know that as a lukewarmer, I have as little patience with outright CO2 warming deniers as I do with those declaring a catastrophe (for my views read this and this). But if you are going to simply be thunderstruck that some people don’t trust climate scientists, then don’t post a chart that is a great example of why people think that a lot of global warming science is garbage. Here is Drum’s chart:
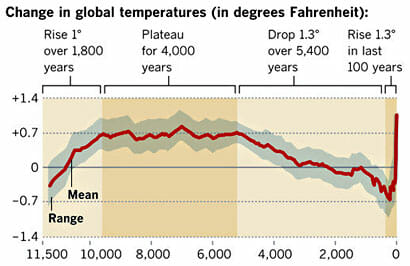
The problem is that his chart is a splice of multiple data series with very different time resolutions. The series up to about 1850 has data points taken at best every 50 years and likely at 100-200 year or more intervals. It is smoothed so that temperature shifts less than 200 years or so in length won’t show up and are smoothed out.
In contrast, the data series after 1850 has data sampled every day or even hour. It has a sampling interval 6 orders of magnitude (over a million times) more frequent. It by definition is smoothed on a time scale substantially shorter than the rest of the data.
In addition, these two data sets use entirely different measurement techniques. The modern data comes from thermometers and satellites, measurement approaches that we understand fairly well. The earlier data comes from some sort of proxy analysis (ice cores, tree rings, sediments, etc.) While we know these proxies generally change with temperature, there are still a lot of questions as to their accuracy and, perhaps more importantly for us here, whether they vary linearly or have any sort of attenuation of the peaks. For example, recent warming has not shown up as strongly in tree ring proxies, raising the question of whether they may also be missing rapid temperature changes or peaks in earlier data for which we don’t have thermometers to back-check them (this is an oft-discussed problem called proxy divergence).
The problem is not the accuracy of the data for the last 100 years, though we could quibble this it is perhaps exaggerated by a few tenths of a degree. The problem is with the historic data and using it as a valid comparison to recent data. Even a 100 year increase of about a degree would, in the data series before 1850, be at most a single data point. If the sampling is on 200 year intervals, there is a 50-50 chance a 100 year spike would be missed entirely in the historic data. And even if it were in the data as a single data point, it would be smoothed out at this data scale.
Do you really think that there was never a 100-year period in those last 10,000 years where the temperatures varied by more than 0.1F, as implied by this chart? This chart has a data set that is smoothed to signals no finer than about 200 years and compares it to recent data with no such filter. It is like comparing the annualized GDP increase for the last quarter to the average annual GDP increase for the entire 19th century. It is easy to demonstrate how silly this is. If you cut the chart off at say 1950, before much anthropogenic effect will have occurred, it would still look like this, with an anomalous spike at the right (just a bit shorter). If you believe this analysis, you have to believe that there is an unprecedented spike at the end even without anthropogenic effects.
There are several other issues with this chart that makes it laughably bad for someone to use in the context of arguing that he is the true defender of scientific integrity
- The grey range band is if anything an even bigger scientific absurdity than the main data line. Are they really trying to argue that there were no years, or decades, or even whole centuries that never deviated from a 0.7F baseline anomaly by more than 0.3F for the entire 4000 year period from 7500 years ago to 3500 years ago? I will bet just about anything that the error bars on this analysis should be more than 0.3F, much less the range of variability around the mean. Any natural scientist worth his or her salt would laugh this out of the room. It is absurd. But here it is presented as climate science in the exact same article that the author expresses dismay that anyone would distrust climate science.
- A more minor point, but one that disguises the sampling frequency problem a bit, is that the last dark brown shaded area on the right that is labelled “the last 100 years” is actually at least 300 years wide. Based on the scale, a hundred years should be about one dot on the x axis. This means that 100 years is less than the width of the red line, and the last 60 years or the real anthropogenic period is less than half the width of the red line. We are talking about a temperature change whose duration is half the width of the red line, which hopefully gives you some idea why I say the data sampling and smoothing processes would disguise any past periods similar to the most recent one.
Update: Kevin Drum posted a defense of this chart on Twitter. Here it is: “It was published in Science.” Well folks, there is climate debate in a nutshell. An 1000-word dissection of what appears to be wrong with a particular analysis retorted by a five-word appeal to authority.
This is a little shorter time span. What gives this strength is that it is multiple studies. They are coming to the same conclusion that we are in a warmer time than the last 2000 years.
“
http://www.realclimate.org/index.php/archives/2013/09/paleoclimate-the-end-of-the-holocene/
Marcott et al. dryly state about this future prospect:
By 2100, global average temperatures will probably be 5 to 12 standard deviations above the Holocene temperature mean.
In other words: We are catapulting ourselves way out of the Holocene.
“
Astonishing graph.
Um just wondering, what kind of satellites were they using to measure global temperature anomalies back 11,000 years ago? No wait 1000 years ago? No wait only 100 years ago?
Oh that’s right, they didn’t use satellites, they used tree rings and swamp scum. And wow, they are accurate to +-.3C. That’s a 10th of a degree.
I didn’t know that all I have to do is look at tree rings and I’ll know the temperature of the earth 100 years ago to within +- .3C.
And you believe that. Wow, someone could sell you people anything.
Let me guess, you’re all Arts majors right?
It is a rigorous peer reviewed science regimen that comes to these conclusions. Simple cynical doubt does not automatically erase scientific study. You have to do better.
Perhaps, but I think the quality of the study itself will erase it for me, thanks.
cheers
The quality of your objection is lacking. It hasn’t stopped the wheels of science at all. Saying pond scum doesn’t change anything.
Being reviewed by Michael Mann or Phil Jones doesn’t inspire a lot of confidence. They’ve both been caught out with unscrupulous practices in defense of their position on a climate catastrophe, and they’ve both been caught out publishing material that, once it gets a real review, falls apart rather badly.
They claim all of this is okay because the issue is more important than following proper scientific procedures.
Boy you are just ripping and tearing. Uh um. How about showing me a link? Never heard that one.
This is what’s known as an appeal to authority. Just because something has been peer reviewed does not mean that it’s correct.
And for the record, the data might not be incorrect. The chart you posted compares means of sample sizes collected from different populations using different proxies at different rates by different instruments, most of which do not (and cannot) include a standard deviation.
Given the source of the data, asking for precision of less than 1 degree is absurd on its face. But what’s REALLY pathetic is that AGW “scientists” expect us to accept a comparison of multiple means without telling us anything about variance If I tried to get away with this in my field (finance) I would quite literally be laughed out of the room.
If they haven’t cheated like the fossil fueled deniers have done in the past on science, it gets out into the public sphere in which everybody has a stab at it. Assuming peer reviewed in earnest the 3 or 4 peer scientists have approved it for its first step. I’m sure those particular scientists have considered the possible flaws and weaknesses.
Assuming we are talking about reconstruction of temperature, it s the methods and procedures that they use to best represent what the data is showing us.
The first part of your response falls so squarely in the category of tu toque that I won’t even bother to address it. Just because somebody else does something wrong doesn’t make it right when you do it. To think that it does is not science but politics.
I’m not sure what the rest of your comment is supposed to convince me of. What you have shown me is a correlation. But look more closely… temperature almost always leads CO2. Gee, I wonder why this chart was designed this way….
If the lines were drawn on top of each other they way a normal person presents data like these you would have to explain how something that occurred after cause the event before. So yes, this too is an example of deception on the part of AGW “scientists”.
P.S. Dont give me some BS about CO2 measurements being lagged. The X axis is in years and the Y in CO2, so any lag that present in the proxy is already worked into the model.
You can see all the deception you want. I can’t stop that observation on your part and don’t care to.
So far as I can tell you haven’t produced what you say is deception.
Please clearly show me the deception. Use your best science. That would include links.
If you really understood the science you would realize there is none.
co2 solubility in the oceans decreases with rising temperature.
http://www.skepticalscience.com/co2-lags-temperature.htm
CO2 didn’t initiate warming from past ice ages but it did amplify the warming. In fact, about 90% of the global warming followed the CO2 increase.
http://www.skepticalscience.com/co2-lags-temperature-intermediate.htm
When the Earth comes out of an ice age, the warming is not initiated by CO2 but by changes in the Earth’s orbit. The warming causes the oceans to release CO2. The CO2 amplifies the warming and mixes through the atmosphere, spreading warming throughout the planet. So CO2 causes warming AND rising temperature causes CO2 rise. Overall, about 90% of the global warming occurs after the CO2 increase.
When you arrange data in such a way that they appear to support an argument more strongly than they really do, this is deception.
Kevin Drum took 100 years using high resolution, high precision data and visually compared it to thousands of years of low resolution, low precision data. If you understand anything about statistics, then you MUST agree with me that you cannot make a meaningful comparison between these two groups. But Mr. Drum made the comparison anyway, and then published this comparison in a magazine often read by the general public that has no chance of catching the problem themselves.
If that is not intentional deception, then what is it? A snowballed rookie mistake? So much for reliability of peer review then, huh?
Since it’s obvious that no amount of junking of your argument is going to change your conclusion, I’m going to leave you with a few thoughts about science and research are supposed to be done.
A real scientist forms a null hypothesis that is the opposite of his claim and then tries to prove that claim wrong. This is done so that we don’t confuse one possible explanation for the only explanation. But this is not what you, or the “science” your argument relies on does…
We started by showing you that because a historical standard deviation of less than 0.5 degrees Fahrenheit is not only an invalid assumption but an absurd one. This means that every conclusion that relies on this assumption must tossed out. In other words, Mr. Drum’s paper belongs in the trash bin.
In defense, you posted an argument that uses the SAME data and assumptions that are faulty in the same way. That’s not deceptive?
You also posted a luminescence chart of the greenhouse gasses in the atmosphere that conveniently leaves out H2O. And you expect me to believe this was not deception, but something else?
Worst of all, you posted picture of a correlation between CO2 and temperature that just happens to drawn in such a way that its hard to see that temperature leads CO2. But you weren’t trying to deceive me?
Look you seem like a nice guy with good intentions. And based on your comments, you probably think that if these scientists are lying, then they are doing it for the “right” reasons. But in science, there is never a right reason to lie.
Farewell.
A real scientist forms a null hypothesis that is the opposite of his claim and then tries to prove that claim wrong. This is done so that we don’t confuse one possible explanation for the only explanation. But this is not what you, or the “science” your argument relies on does…
################################
Here you are just wrong.
The different mechanisms that can cause climate change have been assessed. Science is done transparently to avoid the charlatans or just mistakes. It is a self healing self regulated entity.
The reasons climate can change
1. the sun
2. ghg’s natural and manmade
3. volcanoes (aerosols)
4. climate oscillations
However you figure it out, manmade co2 is causing the warming.
What truly weakens the doubters/deniers argument is that the natural forces are cooling. Every bit of the warming is caused by humans.
If there is a lie in this, by all means show me.
http://en.wikipedia.org/wiki/Attribution_of_recent_climate_change
The dominant mechanisms (to which recent climate change has been attributed) are anthropogenic, i.e., the result of human activity. They are:[1]
increasing atmospheric concentrations of greenhouse gases
global changes to land surface, such as deforestation
increasing atmospheric concentrations of aerosols.
There are also natural mechanisms for variation including climate oscillations, changes in solar activity, and volcanic activity.
You have truly failed to falsify the agw argument.
http://www.desmogblog.com/2014/01/08/why-climate-deniers-have-no-scientific-credibility-only-1-9136-study-authors-rejects-global-warming
1 author out of 9136 authors rejects global warming in the time of Nov. 12, 2012 through December 31, 2013. If you are going to assume I’m duped without showing evidence of such a thing, then show me these scientists are all liars as you say.
Sorry, but you are looking like the conspiracy thinker here. Don’t need any proof, just more confirmation of your preset ideas.
H2O is included. This figure is from the IPCC AR4. Showing that water vapor is increasing in the atmosphere.
Interesting thought. Do you think the models would not include h2o in their calculations? That is just delusional.
You REALLY don’t get it do you?
The charge is not on me to falsify any argument, because I’m not the one making the claim. This is what is called the burden of proof fallacy.
It’s not on me to prove that the standard deviation of temperature was greater than half a degree. YOU need to prove (as opposed to showing that it’s possible) that the standard deviation was NOT greater than half a degree. To think any other way is NOT scientific!!!
Like most AGW “scientists” have no concept of what a null hypothesis is. Google up on it.
I’m wrong because what? I think that a means comparison experiment should test whether the null hypothesis is false? This statement just makes you a moron, sorry. When comparing the means of two or more groups, it’s not useful to know that the two groups could be different. What’s useful is knowing that it is highly improbable for them to be the same.
Nobody is denying that CO2 has some warming effect. Now you’re resorting to making a straw man. You’ve managed to commit almost all of the logical fallacies I know now.
What we’re saying is that the data do not rule out natural variation as the substantial cause of the warming. No amount of peer review can change the fact that assuming a historical moving standard deviation of temperature to be less than half a degree Fahrenheit to be absurd. And that’s what you need to make the present statistically different than the past.
A real scientist forms a null hypothesis that is the opposite of his claim and then tries to prove that claim wrong.
#################
The reasons climate can change
1. the sun
2. ghg’s natural and manmade
3. volcanoes (aerosols)
4. climate oscillations
There isn’t one other reason that climate could change, there are three.
######################
What we’re saying is that the data do not rule out natural variation as the substantial cause of the warming we’ve seen in the past century (until 2000 anyway). No amount of peer review can change the fact that assuming a historical moving standard deviation of temperature to be less than half a degree Fahrenheit is absurd.
####################
In your last statement, there really is no peer reviewed science supporting you. Although I am used to people faking that the science is somehow wrong with no evidence to show for it. I’ll give you credit, you are better than most. CO2 is a slow relentless warmer of the earth.
You still don’t get it. I don’t need to prove that there is not a difference between the means because that’s the null hypothesis…. It’s on you to prove that there is. *sigh*
The earth has warmed and you can’t explain why.
Innuendo does not disprove warming of the earth by humans. Evidence proves global warming, you must prove with evidence it is something else.
The reasons climate can change
1. the sun
2. ghg’s natural and manmade
3. volcanoes (aerosols)
4. climate oscillations
Scientists know the exact bands of energy decrease leaving the earth at the top of the atmosphere. That is a pretty solid piece of physics along with others.
I am an avid reader of the climate science and the climate sensitivity is looking like its higher than lower than like the doubters/deniers would like to think.
My goodness you are dense man. We know that the Earth’s temperature has some natural variation. So before we have to explain anything, we first have to know if the warming we have seen can be attributed to natural variation.
In order to do this we need statistics, specifically a means test. This is in fact, this is what all of your peer reviewed garbage uses. So shut up and listen for a moment and learn something…
When performing a parametric means test you need to know, as a bare minimum the sample mean and standard deviation.
Your AGW pals can use proxies to get a decent idea of the mean, and for the moment we can assume that the proxies are accurate and precise enough measurements of the means. The problem with these proxies is that they only report a mean and not a standard deviation. So they just assume one based on pretty much nothing and often leave this assumption unstated or leave it buried in a chain of citations.
The neat thing about statistics is that you can work backwards to find the standard deviation implied by the warrant… Pay close attention now…
Even if all the historical temperature records are correct, in order for the 1.4 degree rise in temperature to be statistically significant you would need a historical moving standard deviation of less than half a degree Fahrenheit. Such an assumption is absurd on its face… but again I need not prove it’s absurd because it’s not my assumption. In science it’s up to the person making the claim to back up his assumptions which is something AGW scientists tend to duck (except for saying that it was peer reviewed). To reverse this burden of proof which you have done several times in this thread is a logical fallacy that’s not permitted in any other field of science.
Do yourself a favor and pick up a college level stats book. It will go a long way in helping you see the deception. Without understanding what a sample mean is and why variance/standard deviation are so important when making comparisons, you are a sitting duck and will continue to be fooled by “scientists” with an agenda.
Peer reviewed science is still deception?
I see questioning, but no falsification.
Since I am not a scientist, I am going to limit myself based on my skills. But I will say if you want to question the validity of thousands of peer reviewed papers based on the temperature record showing an increase in temperature, then you need to take that argument to a different blog or go into the science and write your own paper.
But having said that, these graphs have stood the test of time in peer reviewed literature. By all means take up this argument with someone more skilled than myself and go over all the nits of temperature validity.
The first proxy is of the ice cores themselves and are recognized as valid by even more deniers. Have at it on that one.
The second one is proxies going back to the ice ages. This is a little newer, but has made peer review and beyond. There may be possibilities of missteps. That will come out as others do the same studies to see if they replicate or get the same results. The third one is also proxies going back a few thousand years and they are proven over time that several studies come to the same conclusion.
Our time is unusual in the history of earth. This is showing us that we are warmer than the beginning of the Holocene. We are warmer than the existence of modern man has experienced and we are going to get warmer based on our carbon emissions. How warm is up to us as a collective world society. Doubters/deniers have fought this one tooth and nail and loose every time. But what is true withstands the onslaughts of those who can’t accept it.
Yes, peer reviewed research can be wrong and/or deceptive. AGW would not be the first time.
You are putting far too much trust and faith in not only the peer review process but also in the number of papers on it. Many of the thousands you are referring to make no claim that warming we have experienced can be attributed to man made causes. Stop deluding yourself.
What is settled is that CO2 is a greenhouse gas. There is almost no debate about this so stop pretending that there is. What is in dispute is the sensitivity of the climate to changes I CO2. Hockey stick proponents (of where there actually arent that many, but they get all the press due to sensationalism) rely on the faulty assumptions we’ve beaten dead here. Are these outcomes possible? Certainly. But there is no scientific or statistical basis for believing that they are likely.
As for peer reviewed research, there is plenty out there that debunks AGW. But it doesn’t get a lot of press because saying the world is not going to end is not sensational and doesn’t get you grant money. So please stop pretending that there is consensus on something there is not.
Start here (yes it’s peer reviewed):http://www.nipccreport.org
This is funny. I can’t even take you seriously when you put up this kind of information. You have just brought up the whose who of deniers. Tobacco trained and oil industry paid. You talk about poor judgment. Yours takes the cake here.
But interesting you aren’t naïve. You are just blind due to your world view. Nobody even spends time debunking these guys because it is just wrong, wrong, wrong.
I’ll let you bring up their points that claim AGW is no big deal. I’ll be happy to respond to every point you have.
Summary for Policymakers
Lead Authors/Editors:
Craig D. Idso (USA), Robert M. Carter (Australia), S. Fred Singer (USA)
########################
http://www.desmogblog.com/craig-idso
May 21 – 23, 2012
Craig Idso was a speaker at the Heartland Institute’s 7th International Conference on Climate Change (ICCC7).
DeSmogBlog researched the co-sponsors behind Heartland’s ICCC7 and found that they had collectively received over $67 million from ExxonMobil, the Koch Brothers and the conservative Scaife family foundations.
http://www.desmogblog.com/rm-bob-carter
May 21 – 23, 2012
Bob Carter was a speaker at the Heartland Institute’s 7th International Conference on Climate Change (ICCC7).
DeSmogBlog researched the co-sponsors behind Heartland’s ICCC7 and found that they had collectively received over $67 million from ExxonMobil, the Koch Brothers and the conservative Scaife family foundations.
Heartland’s president Joe Bast revealed at the end of the conference that the Institute has no plans for future ICCCs. This could be in part due to the defections of corporate sponsors following Heartland’s the unintended release of their confidential documents and its unsuccessful Unabomber billboard campaign. Carter was one of the few people to have subsequently backed Heartland’s decision to run the billboard campaign.
http://www.desmogblog.com/s-fred-singer
Background
Siegfried Frederick Singer (S. Fred Singer) is a former space scientist and government scientific administrator.
Singer runs the Science and Environmental Policy Project (SEPP), an organization which focuses on global warming skepticism. According to their website, SEPP also covers topics such as nuclear radiation, DDT, science and regulation at EPA, energy policy, and space exploration.
According to leaked documents, Singer has been receiving $5,000 a month from the Heartland Institute.
You can’t take me, or these scientists seriously because what? There might be a financial incentive for the scientists to come to the conclusion that they did?
And somehow you think AGW scientists paid through government grants don’t have financial incentive? Get real man.
Just because a person has an incentive to lie doesn’t mean they will. You cannot discard research on the sole basis of funding – to do so commits the genetic logical fallacy. You seem to have a real problem with critical thinking. And I’d be willing to bet I’m not the first person to tell you that.
Funny you can quickly find information on the NGIPCC contributors but you can’t find information about Michael Mann or Phil Jones.
sledge
that’s your job.
So unless I slap you with the truth, it doesn’t exist?
You’ll go looking for information to smear “deniers” but not those that are part of the “consensus?”
Confirmation bias much?
You can’t take me, or these scientists seriously because what? There might be a financial incentive for the scientists to come to the conclusion that they did?
################
Now I know you lack judgment.
###############
And somehow you think AGW scientists paid through government grants don’t have financial incentive? Get real man.
###################
It shows you don’t understand the science process. Thou who wins by interpreting the data correctly gets the credit. One gets it wrong and another gets it right later. THe 2nd one gets the credit.
##################
Just because a person has an incentive to lie doesn’t mean they will.
##############
I know the names and their history. I’m saying their science is quite flawed before I look, because I already know. But you are welcome to bring on the science. I eagerly await your defense,
Slap away. I eagerly await. This will be fun.
You’re lack of critical thinking skills is truly astounding.
Here’s what you just did:
1) Dozens of scientists put together a report showing skepticism of AGW science
2) Some of the scientists are paid by a “denier” think-tanks and private companies, therefore the report in (1) is invalid.
3) Sledge2k believes that the report makes a compelling argument, therefore he lacks judgement.
Since (2) is the result of a blatant logic error, (3) is non sequitur.
As for understanding the “science process” you again show your ignorance. Science is not about winning and losing but discovering truth.
You “win” by contributing to the discovery of that truth, even if your theory or hypotheses turn out to be wrong. Open any scientific journal from just 20 or 30 years ago and it will be filled with things that are wrong as I think you are trying to point out. But you are wrong to think that the previous researchers were “losers” or that he who improves on the theory is necessarily right or a “winner.” By your definition, Isaac Newton was not a winner…
It’s the jackasses that bring ideology into the filtering, coding, and analysis of data that are the problem. For these people being wrong means they would be forced to question their ideology which is something humans don’t like to do. Just imagine if you had managed to spend a decade in school earning your Ph.D. You might understand statistics better, but you’d likely still have the same dismissive attitude towards criticism which means you would be a terrible scientist. Thankfully, you lack such dedication to your cause.
“I know the names and their history. I’m saying their science is quite flawed before I look, because I already know. But you are welcome to bring on the science. I eagerly await your defense,”
Now you and I both know you’re lying. You have no idea who these people are and have not read their research. And given your dismal understanding of the scientific method (self admitted) and statistics, it’s hard to imagine how, even if you had read the research, you could possibly have come to any conclusion that it’s flawed.
Now I know I’m getting to you 🙂
Unfortunately this is about as fun as making fun of the retarded kid on the bus.
Also, if you are going to make the claim the research is “flawed” it’s on you to say how, as I have done on the flip-side.
I eagerly await your offense.
That’s funny, you haven’t even talked science yet. I could get bored at your lack of ability here.
I don’t pick on the weak. You do?
I haven’t talked science?
Scroll up. What do you think all that about proxies, means, variance, standard deviation, etc. was about? Just because you lack the ability to comprehend it doesn’t disqualify it from being science (and entry level at that).
That depends. If you think I’m picking on you, then I suppose I do.
No science? It appears you are incompetent in this area. Why are you here if you are so ineffective?
My god man. You must have amnesia? I’m not going to explain this again… Just scroll up.
Sorry man. You are just not good at science. Its too bad. I’m getting tired of you.
Do you always act like a child when you lost an argument? This is pretty hilarious.
No. I don’t take advantage of the weak like you do.
The reasons climate can change
1. the sun
2. ghg’s natural and manmade
3. volcanoes (aerosols)
4. climate oscillations
Science isn’t your strong subject. I don’t know what you think you are winning, but I’ll let you have your delusion.
Yea I see that now. Its pretty interesting. You frustrate your opponents when you can’t win the science. Its making sense.
I still am noticing you won’t go into NIPPC to bring out their points. After all, my joy is discussing the science of the matter.
Where does NIPPC get it right and IPCC get it wrong?
What you’re doing now is something called reflection. You’re accusing me of using the only strategy you know.
As for the science, you’ve done absolutely nothing but post graphics from other peoples work. That’s not discussing science, but assertion. This is so because you (self admittedly) don’t have the skills necessary to understand the methods used to connect the data to the conclusion. If you don’t understand why two samples of vastly different sizes and rates (among other things) must have similar variances to make a meaningful comparison of their respective means, we can’t have a scientific discussion. I’ve tried my best to explain these things to you, but you’ve clearly made up your mind. Discussing science with you is like trying to discuss algebra with a child who refuses to first learn arithmetic.
If you are really a truth seeker then I suggest you sign up for an intro to statistics at your local community college. I’d also encourage you to take a logic test such as the one found here (http://www.think-logically.co.uk/lt2.htm) which I hope will shed a neutral light on your critical thinking skills as they are. I’m sure you’ll come back and report 100% or something, but I hope that at least you seeing the actual results and explanations might help you to understand that the logic principles I’ve been hitting you with are universal and a prerequisite for science.
Again you are trying to bait me into proving that AGW is false when I have no such duty, nor does the NGIPCC. Rather the NGIPCC points our problems with the IPCCs argument alternative theories that are just as likely, if not more likely to be true than AGW theories.
If you make a claim, IF A, THEN B. And I can show you a situation (or many of them) in which there IS A, BUT NOT B, then you’re claim is falsified and that is the end of your theory. Saying, well IF A, AND NOT B, THEN WHAT? This is a serious logical error… (see my other post on taking a logic test).
Again you are trying to bait me into proving that AGW is false when I have no such duty, nor does the NGIPCC. Rather the NGIPCC primarily points out problems with the IPCC’s argument alternative theories that are just as likely, if not more likely to be true than AGW theories. To you and your screwed up definition of science, showing how somebody is wrong without providing an alternative theory probably seems unproductive and/or mean. But science is about skepticism…
If you make a claim that all flowers are red, but I can show you a blue flower, then your claim is false. I DON”T need to show you how many blue cars there are or be able to explain why they are blue; your claim is false regardless. To maintain your position that all flowers are red because I cannot tell you why some are not, is a serious logic error. (See my other post about taking a logic test)
One of the most fundamental criticisms made in the NGIPCC report is the same one made in this article and by myself: we have a very low resolution (and possibly low quality, but we can ignore this for the moment) historical record of temperature. We cannot have any understanding of variation for most of history because all we can do is get a rough idea of the mean temperature for long periods. Despite all this, AGW scientists build extremely complicated models that claim to have an astounding level of accuracy and precision (error bars of 0.4 degrees Fahrenheit for example). Alas you probably did not understand anything I just said which is why you don’t consider it “talking science” as you would say. But, like it or not, this is how scientific discourse sounds so if you want to play ball, you need to learn the terms buddy.
http://www.skepticalscience.com/news.php?n=1295
Second, unlike the IPCC report, the scientists contributing to the NIPCC report are paid for their efforts. The overall Heartland budget for the NIPCC reports from 2010 to 2013 is nearly $1.6 million ($388,000 in both 2011 and 2012), with $460,000 going to the lead authors and contributors ($140,000 in both 2011 and 2012). The 2011 Interim NIPCC report has 3 lead authors (Craig Idso, Fred Singer, and Robert Carter) and 8 contributors (Susan Crockford, Joe D’Aleo, Indur Goklany, Sherwood Idso, Anthony Lupo, Willie Soon, Mitch Taylor, and Madhav Khandekar), most of whom also receive a monthly salary from the Heartland Institute.
###################
Again a list of well known fossil fuel funded deniers.
######################
http://www.skepticalscience.com/news.php?n=1295
The purpose of the IPCC report is:
“to provide the world with a clear scientific view on the current state of knowledge in climate change and its potential environmental and socio-economic impacts….The IPCC is a scientific body. It reviews and assesses the most recent scientific, technical and socio-economic information produced worldwide relevant to the understanding of climate change.”
######################
Looks like low credibility. But to a seasoned denier like yourself, the NIPCC is the jackpot. Fits right into your white paranoid, antigovernment, conservative thinking.
Since I don’t see things the way you do, you can focus your paranoia on the graph below.
The ant stands for anthropogenic forcing meaning that is us.
Within the uncertainty range humans have done about .6 to .8*C of the warming which would be almost all of it.
I’ve read enough material from the paranoid denier club, that they would like to think that it might be all natural.
According to the IPCC, that’s not the case.
Natural variation is small and anthropogenic is overwhelming.
Figure 2. Assessed likely ranges (whiskers) and their mid-points (bars) for attributable warming trends over the 1951–2010 period due to well-mixed greenhouse gases (GHG), other anthropogenic forings (OA), natural forcings (NAT), combined anthropogenic forcings (ANT), and internal variability. The HadCRUT4 observations are shown in black with the 5–95% uncertainty range due to observational uncertainty. – See more at: http://www.realclimate.org/index.php/archives/2013/10/the-ipcc-ar5-attribution-statement/#sthash.nCtpnJXb.dpuf
Multiple data sets coming up with the same significant trend of warming on the earth’s surface. I can’t speak to the resolution at the this point, but I do have the work of several teams of scientists coming up with pretty much the same conclusion. There is uncertainty, and within that uncertainty there is a very clear warming trend.
http://www.skepticalscience.com/surface-temperature-measurements-intermediate.htm
Figure 2: Temporal comparison of near-global land (90°N–60°S) 2 meter air temperature anomalies (TL2m) between 20CR and station-temperature based estimates. Red curve: global TL2m anomaly series from CRUTEM4, black curve: the average of five additional station-temperature datasets, and blue curve: the 20CR. 95% uncertainty ranges are shown for CRUTEM4 (yellow fill) and 20CR (blue fill) and their overlap (green fill). From Compo et al. (2013)