The fact that CO2 in the atmosphere can cause warming is fairly settled. The question is, how much? Is CO2 the leading driver of warming over the past century, or just an also-ran?
Increasingly, scientists justify the contention that CO2 was the primary driver of warming since 1950 by saying that they have attempted to model the warming of the last 50 years and they simply cannot explain the warming without CO2.
This has always struck me as an incredibly lame argument, as it implies that the models are an accurate representation of nature, which they likely are not. We know that significant natural effects, such as the PDO and AMO are not well modelled or even considered at all in these models.
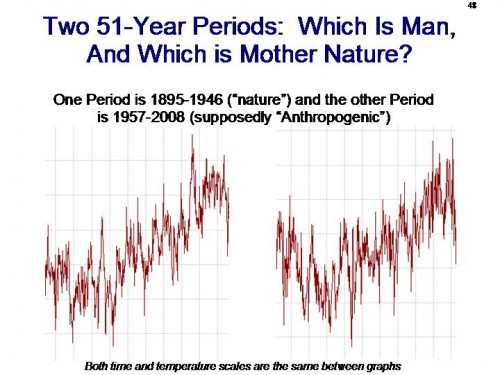
But for fun, lets attack the problem in a different way. Below are two global temperature charts. Both have the same scale, with time on the X-axis and temperature anomaly on the Y. One is for the period from 1957-2008, what I will call the “anthropogenic” period because scientists claim that its slope can only be explained by anthropogenic factors. The other is from 1895-1946, where CO2 emissions were low and whose behavior must almost certainly be driven by “nature” rather than man.
Sure, I am just a crazy denier, but they look really similar to me. Why is it that one slope is explainable by natural factors but the other is not? Especially since the sun in the later period was more active than it was in the earlier “natural” period. So, which is which?
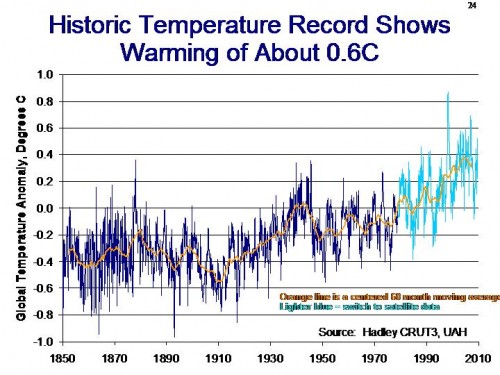
Note that these two are straight cut and pasts from this graph:


Wouldn’t the AGW true believers say something along the lines that the two graphs start from different points and that is why CO2 forcing is the only explanation?
Of course that requires ignoring all the problems with generating a hockey stick in recent times and that the sun was more active in the later period.
Or maybe they will just reference Gavin’s post in response to the Yamal issues where he threw in a bunch of hockey sticks regardless of how irrelevant or already debunked they were.
Sadly, I worry there is too much prestige and money at stake on the science side and too much power and control at stake on the political side to stop all this garbage.
And note that there is a small but real possibility that the temperature data in the graphs may even be somewhat accurate!
Oh great, a “new” approach indeed. Bah! You’ren’t a “crazy denier”, you are a LAZY denier.
Warren: Do you know of any sources showing estimates of the use of fossil fuels or CO2 emissions over time? 1895-1946 was a period of rapid industrialization based on fossil fuels – often at very low efficiency compared to now – so claims that the emissions were negligible need to be backed up.
Ideally, such data would go back at least to the widespread use of coal for heating in 18th Century England. They may not have kept very warm, but at least part of that is because most of the heat went up the chimneys. And a Newcomen engine supplying a fraction of a HP to pump water out of a coal mine would have burned more fuel and emitted more CO2 than a modern SUV on the freeway.
IPPC AR4, Chapter 9, p682
http://www.ipcc.ch/publications_and_data/publications_ipcc_fourth_assessment_report_wg1_report_the_physical_science_basis.htm
Shows GHG+Aerosol effects started contributing to forcing ~1900 (versus Solar and Volcanic). These look to be backed out from different simulations.
Same document as above, p669: “In contrast,
a limited number of simulations of the response to known
natural forcings alone indicated that these may have contributed
to the observed warming in the first half of the 20th century, but
could not provide an adequate explanation of the warming in
the second half of the 20th century, nor the observed changes in
the vertical structure of the atmosphere”
It looks to me like they’re simply being much stricter with the second half than with the first half of the 20th century.
On page 684, figure 9.5 a shows a simulated curve that matches the second half well, but creeps lazily upwards during the first half with no peak around 1940.
Thank you,
very interesting article